
Office of Infrastructure of Canada
Quarterly Financial Report for the quarter ended December 31, 2022
Office of Infrastructure of Canada
Quarterly Financial Report for the quarter ended December 31, 2022

Office of Infrastructure of Canada
Quarterly Financial Report for the quarter
ended December 31, 2022
(PDF Version)
Statement outlining results, risks and significant changes in operations, personnel and programs
Introduction
This quarterly report has been prepared by management as required by Section 65.1 of the Financial Administration Act and in the form and manner prescribed by the Treasury Board. This quarterly report should be read in conjunction with the Main Estimates as well as Budget 2022.
The key to building Canada for the 21st century is a strategic and collaborative long-term infrastructure plan that builds economically vibrant, strategically planned, sustainable and inclusive communities. Infrastructure Canada (INFC) works closely with all orders of government and other partners to enable investments in social, green, public transit and other core public infrastructure, as well as trade and transportation infrastructure.
Further information on INFC's mandate, responsibilities, and programs can be found in INFC's 2022-23 Main Estimates.
Basis of Presentation
This quarterly report has been prepared by management using an expenditure basis of accounting. The accompanying Statement of Authorities includes INFC's spending authorities granted by Parliament and those used by INFC consistent with the Main Estimates and Supplementary Estimates for the 2022-23 fiscal year (FY). This quarterly report has been prepared using a special purpose financial reporting framework designed to meet financial information needs with respect to the use of spending authorities.
The authority of Parliament is required before monies can be spent by the government. Approvals are given in the form of annually approved limits through Appropriation Acts or through legislation in the form of statutory spending authority for specific purposes.
INFC uses the full accrual method of accounting to prepare and present its annual departmental financial statements that are part of the departmental performance reporting process. However, the spending authorities voted by Parliament remain on an expenditure basis.
In the past, INFC has worked in collaboration with other federal departments and agencies to deliver some of its transfer payment programs (collectively known as federal delivery partners) and that remains accurate for the 2022-23 fiscal year.
It should be noted that this quarterly report has not been subject to an external audit or review.
Highlights of Fiscal Quarter and Fiscal Year-to-Date Results
This section highlights the significant items that contributed to the change in resources available for use from 2021-22 to 2022-23 and in actual expenditures from 2021-22 to 2022-23 as at December 31 (third quarter).
Authorities
Graph 1: Comparison of Authorities Available as of December 31, 2021 and December 31, 2022
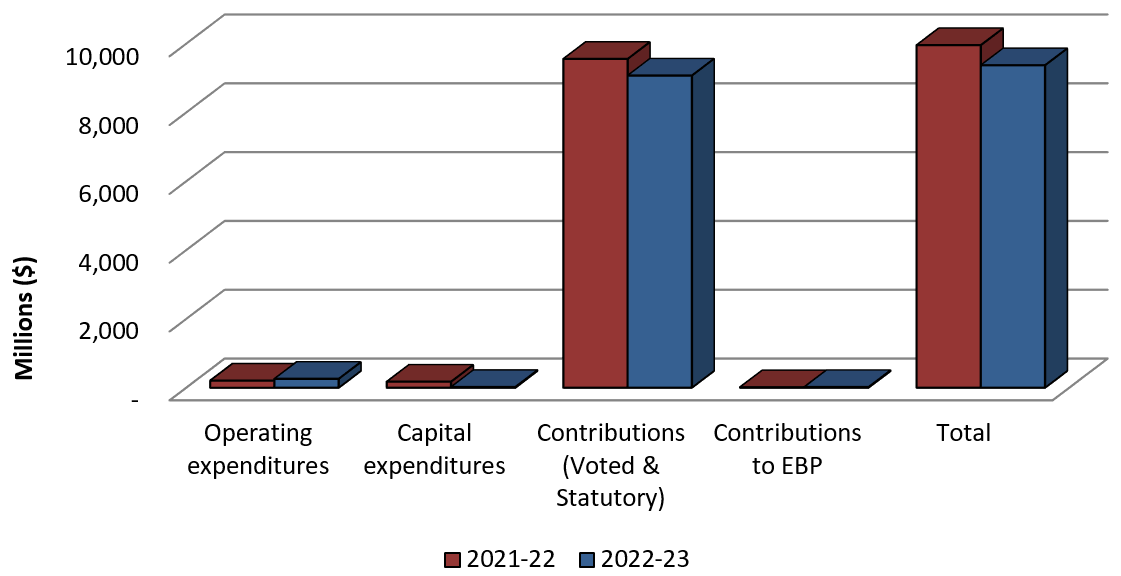
Text description of Graph 1: Comparison of Authorities Available as of December 31, 2021 and December 31, 2022
Bar graph showing the comparison of authorities available for use as of December 31, 2021 and December 31, 2022.
- Operating authorities available as of Q3 2021-22 were $207.7 million, compared with $258.8 million as of Q3 2022-23.
- Capital authorities available as of Q3 2021-22 were $179.9 million, compared with $21.7 million as of Q3 2022-23.
- Contribution (Voted and Statutory) authorities available as of Q3 2021-22 were $9.6 billion, compared with $9.1 billion as of Q3 2022-23.
- Contributions to the Employee Benefit Plan authorities available as of Q3 2021-22 were $15.1 million, compared with $18.8 million as of Q3 2022-23.
- The total of authorities available for use as of Q3 2021-22 were $9.9 billion, compared with $9.4 billion as of Q3 2022-23.
As shown in the Statement of Authorities, INFC's total authorities available for 2022-23 are $9.37 billion as of the end of the third quarter (Q3) and represent a $0.58 billion decrease compared to the same quarter in the prior year (PY).
This decrease is summarized in the table below:
| Authorities |
Increase/(Decrease) vs. Prior Year-to-date (000's) |
|---|---|
Operating Expenditures |
51,136 |
Capital Expenditures |
(155,214) |
Contributions (Voted and Statutory) |
(483,938) |
Contributions to Employee Benefit Plans (EBP) |
3,774 |
The sources of significant year-over-year changes are summarized as follows:
- Operating Expenditures – The increase is due to funding received to deliver the new programs announced in the 2020 Fall Economic Statement and Budget 2021 as well as the authorities from that mandated transfer from Employment and Social Development Canada (ESDC) for the Reaching Home: Canada's Homelessness Strategy program not yet received in 2021-22 Q3.
- Capital Expenditures – The decrease in capital funding is related to funding for land purchases tied to the Gordie Howe International Bridge project which has been reprofiled to future years and to decreased requirements for the Samuel de Champlain Bridge Corridor project.
- Contributions (Voted and Statutory) – The net decrease is attributable to the Canada Community Building Fund top-up sunsetting in 2021-22 which was offset by new programming and other increases in existing programming.
- Contributions to Employee Benefit Plans – This increase is reflective of the growth in full time equivalents (FTEs) associated with the new Programs listed in the Operating Expenditures section and INFC's expanded mandate.
Expenditure Analysis
Expenditures at the end of Q3 were $3.70 billion, compared to $6.04 billion reported in the same period of 2021-22, representing a decrease of 38%. The source of the relative decrease is demonstrated in the tables, graphs and analysis below.
Graph 2: Comparison of Total Expenditures as of December 31, 2021 and December 31, 2022
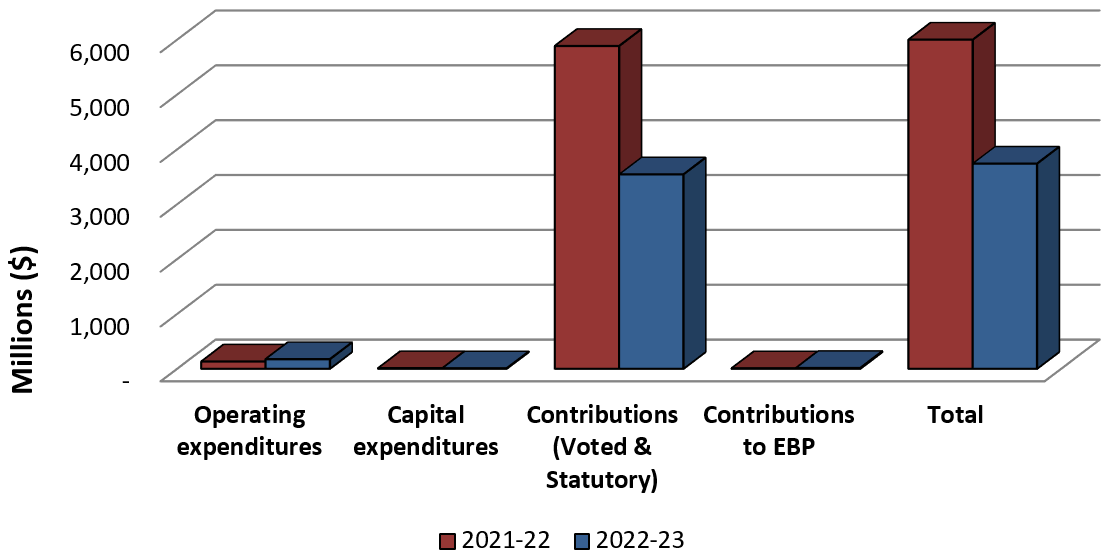
Text description of Graph 2: Comparison of Total Expenditures as of December 31, 2021 and December 31, 2022
Bar graph showing the comparison of total expenditures used year-to-date as of December 31, 2021 and December 31, 2022.
- Authorities used for Operating as of Q3 2021-22 were $132.3 million, compared with $174.6 million as of Q3 2022-23.
- Authorities used for Capital as of Q3 2021-22 were $10.3 million, compared with $8.0 million as of Q3 2022-23.
- Authorities used for Contributions (Voted and Statutory) as of Q2 2021-22 were $5.6 billion compared with $3.5 billion as of Q3 2022-23.
- Authorities used for Contributions to the Employee Benefit Plan as of Q3 2021-22 were $7.9 million, compared with $14.1 million as of Q3 2022-23.
- Total year-to-date budgetary expenditures as of Q3 2021-22 were $6.0 billion, compared to $3.7 billion as of Q3 2022-23.
| Year-to-date expenditures |
Increase/(Decrease) vs. Prior Year-to-date (000's) |
|---|---|
Operating Expenditures |
42,292 |
Capital Expenditures |
(2,300) |
Contributions (Voted and Statutory) |
(2,341,183) |
Contributions to Employee Benefit Plans |
6,192 |
The sources of significant year-over-year changes are summarized as follows:
- Operating and Capital Expenditures – Further details by standard object can be found in Table 4.
- Contributions (Voted and Statutory) – Further details by program can be found in Table 3.
- Contributions to Employee Benefit Plans – This increase is reflective of the growth in full time equivalents (FTEs) associated with the new Programs listed in the Operating Expenditures section above as well as a result of INFC's expanded mandate.
Graph 3: Comparison of Authorities used for Contributions (Voted and Statutory) as of December 31, 2021 and December 31, 2022
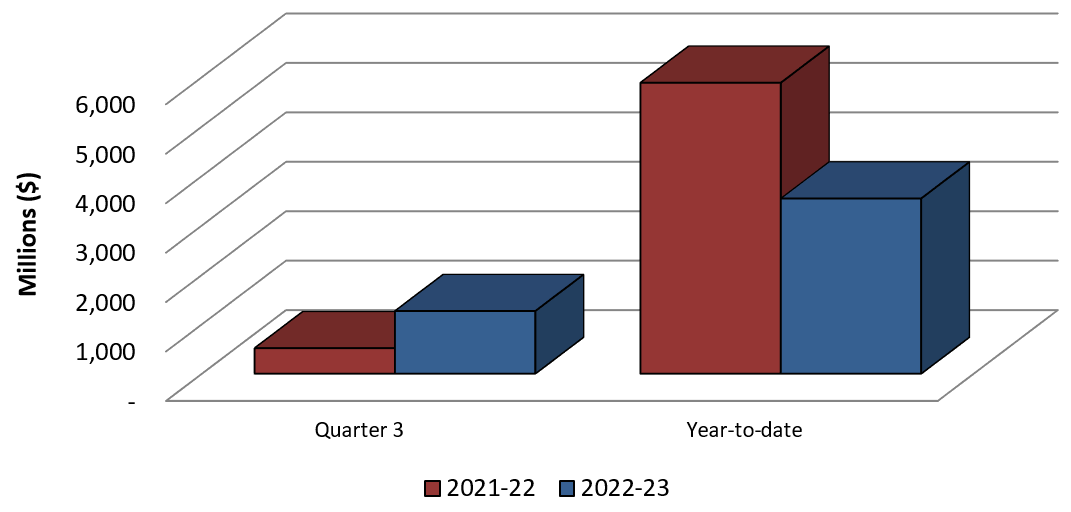
Text description of Graph 3: Comparison of Authorities Used for Contributions as of December 31, 2021 and December 31, 2022
Bar graph showing the comparison of authorities used for Contributions (Voted) and Contributions (Statutory) as of December 31, 2022 and December 31, 2022.
- Contributions expensed on Q3 2021-22 were $0.5 billion, compared with $1.3 billion on Q3 2022-23.
- Total year-to-date contributions expensed as of Q3 2021-22 were $5.9 billion, compared with $3.5 billion as of Q3 2022-23.
Table 3 below shows the most significant changes in year-to-date contribution expenditures by program between December 2021 and December 2022:
| Program Fund |
Increase/(Decrease) vs. Prior Year-to-date (000's)* |
|---|---|
Reaching Home: Canada's Homelessness Strategy (RH) |
498,912 |
Investing in Canada Infrastructure Program - COVID-19 Resilience Stream (ICIP-CVRIS) |
209,407 |
Disaster Mitigation and Adaptation Fund (DMAF) |
50,266 |
Toronto Waterfront (TWRI) |
30,926 |
Green Infrastructure Stream (ICIP-GIS) |
21,463 |
Clean Water Wastewater Fund (CWWF) |
(41,153) |
New Building Canada Fund - National Infrastructure Component (NBCF-NIC) |
(42,479) |
Public Transit Infrastructure Fund (PTIF) |
(137,270) |
New Building Canada Fund-Provincial-Territorial Infrastructure Component-National and Regional Projects (NBCF-PTIC-NRP) |
(242,058) |
Canada Community-Building Fund (CCBF) |
(2,647,529) |
*Note: The table shows the most significant changes which account for a net decrease of $2.99B of the total $2.28B year to date change.
The sources of significant year-over-year changes are summarized as follows:
- Canada Community-Building Fund (CCBF) - $2.6B decrease is a result of two factors. First, a $2.2B top-up payment was released by 2nd quarter in FY 2021-22 in addition to the regular CCBF annual payment. Second, FY 2021-22 payments were provided in one lump-sum at the beginning of the year instead of the regular biannual schedule due to the pandemic. CCBF payments are back to a regular biannual schedule starting in FY 2022-23.
- Reaching Home: Canada's Homelessness Strategy (RH) – While de mandated transfer for RH from ESDC to INFC occurred in October 2021, expenditures were only transferred to INFC after Q3 of fiscal year 2021-22.
- New Building Canada Fund-Provincial-Territorial Infrastructure Component-National and Regional Projects (NBCF-PTIC-NRP) - Fewer claims have been received by the Q3 of FY 2022-23, particularly from Alberta and Quebec, offset by an increase in claims from Nova Scotia.
- Investing in Canada Infrastructure Program (ICIP) - COVID-19 Resilience Stream (ICIP-CVRIS) - With projects well underway, the CVRIS stream of ICIP has received more claims by Q3 of FY 2022-23, particularly from Ontario and Quebec.
- Public Transit Infrastructure Fund (PTIF) - PTIF is coming to the end of its life cycle with the majority of projects approaching completion by 2023-24. Year-over-year expenditures are decreasing as the program approaches closure.
- Disaster Mitigation and Adaptation Fund (DMAF) – The increase in DMAF spending is due to more claims being received by Q3 of FY 2022-23, particularly from Alberta, Ontario and British Columbia.
- New Building Canada Fund - National Infrastructure Component (NBCF-NIC) - Fewer claims have been received by Q3 of FY 2022-23, mostly from Quebec.
- Clean Water Wastewater Fund (CWWF) - CWWF is coming to the end of its life cycle with the majority of projects approaching completion by 2023-24. Year-over-year expenditures are decreasing as the program approaches closure.
- Toronto Waterfront (TWRI) - More claims have been received in Q3 of FY 2022-23 compared to FY 2021-22 from Ontario.
- Green Infrastructure Stream (ICIP-GIS) - The GIS stream of ICIP has received more claims by Q3 of FY 2022-23, particularly from Quebec.
Departmental Budgetary Expenditures by Standard Object
The planned Departmental Budgetary Expenditures by Standard Object are set out in the table at the end of this report. Aggregate year-to-date expenditures in 2022-23 decreased by $2.3 billion, compared with the same quarter last year. The largest single factor was an decrease in transfer payments as explained above.
A breakdown of variances in year-to-date spending by standard object is below:
| Changes to Expenditures by Standard Object |
Increase/(Decrease) vs. Prior Year-to-date (000's) |
|---|---|
Personnel |
35,203 |
Transportation and communications |
416 |
Information |
55 |
Professional and special services |
9,172 |
Rentals |
75 |
Repair and maintenance |
563 |
Utilities, materials and supplies |
67 |
Acquisition of land, buildings and works |
306 |
Acquisition of machinery and equipment |
628 |
Transfer payments |
(2,341,183) |
Public debt charges |
(306) |
Other subsidies and payments |
6 |
The sources of significant year-over-year changes are summarized as follows:
- Personnel – Increase in the number of employees associated with new Programs and the mandated transfer of the Housing and Homelessness portfolio.
- Professional and special services – The increase is mainly due to service costs associated with transition support provided by ESDC for the Reaching Home program and Homelessness Policy Directorate which are governed by a memorandum of understanding between both organizations.
- Transfer payments – Details were previously discussed.
- Acquisition of machinery and equipment – Increase is due to the purchase of computer equipment to accommodate for new employees.
Overall, INFC has spent 40% of its current Total Authorities as of December 31 2022, compared to 61% at the end of Q3 of the previous fiscal year.
Risks and Uncertainties
As part of the Department's corporate risk management function, the Department regularly monitors and identifies strategic risks that may affect the delivery of the Department's mandate and expected results. INFC integrates risk management principles into strategic business planning, results-based management, decision-making and organizational processes to support the achievement of departmental priorities. Risk management at INFC is carried out in accordance with the Treasury Board Secretariat's (TBS) Framework for the Management of Risk, TBS's Guide to Integrated Risk Management, the Management Accountability Framework, and INFC's Integrated Risk Management policy.
One of the Department's key financial risks pertains to INFC's capacity to establish sustainable tools and processes for decision-making on the Flow of Funding.
There are many steps between when funding is announced in the budget and project construction starts that impact the flow of funding. In most cases, INFC funds projects via a Contribution Agreement with the ultimate recipient or Integrated Bilateral Agreement between Canada and a Provincial/Territorial (PT) government. PT governments then enter into their own agreements with municipalities, who are ultimately responsible for project management and construction of the infrastructure. Most of INFC's programs are structured in such a way that funding flows from the Department based on requests for reimbursements. It is important to note that federal spending is not an accurate measure of when the economic activity created by infrastructure spending occurs. When projects are approved, work begins and economic activity is generated by provinces, territories and municipalities, which are responsible for implementing projects and incurring costs. INFC makes the federal contribution only when requested by partners.
There may be delays between when infrastructure activity occurs and when INFC is able to flow funds which is when recipients submit their claims. The ongoing misalignment between authorities and expenditures can result in delays in flowing federal funding. There are a variety of reasons that can affect the timing of requests for reimbursements, which can contribute to a variance between planned spending and actual spending. Some projects, once approved, move quickly into the construction phase while others have longer lead times for planning, and local approval processes (e.g. zoning and permitting). Regardless of how long planning takes or how soon ground can break, eligible costs can be submitted for reimbursement throughout the life of the project. INFC encourages PTs to submit claims in a timely manner to ensure the flow of funding as planned. Parliamentary authority to spend typically expires at the end of the fiscal year; however, in response to the needs of its project partners, INFC reprofiles its authorities as needed so that the funding committed to specific projects continues to be available in future years when needed.
INFC is ramping up its capacity to manage the recent addition of a new mandate and Government of Canada priority (Housing and Homelessness). This is coupled with the rapid growth of the Department's programming in the last few years as INFC has launched an unprecedented number of new programming in 2021 and new recently approved programs through the 2021 Fall Economic Statement and Budget 2022. The latter announcing the government's intentions to accelerate the deadline for Provinces to fully commit their remaining funding under ICIP. All these changes could have a potential impact on both the flow of funding and the anticipated workload.
INFC has worked with provinces and territories to introduce improvements to the flow of funding processes to better align authorities of existing programs to expenditures and improve predictability of high materiality projects. It also used lessons learned from legacy programs to introduce additional flexibilities in the design of new programs such as flexibility in funding mechanism and basis of payments. Further, mandatory biannual reporting requirements and claim frequencies are being directly imbedded within agreement templates for new programs which will likely accelerate the claims process once agreements are approved and improve forecasting accuracy. These efforts should yield important impacts over the coming years.
Significant Changes in Relation to Operations, Personnel and Programs
Infrastructure Canada continues to grow and evolve. Since the last Quarterly Financial Report, the following significant change has taken place within the department:
On October 26, 2021, the Government of Canada issued an Order in Council mandating the transfer of the secretariat to support rural economic development to the Departmental of Industry. As a result, $2.2M was transferred from INFC to the Department of Industry via the 2022-23 Supplementary Estimates B.
INFC is committed to making infrastructure investments that support economic growth and job creation, help combat the effects of climate change, and build inclusive communities. While COVID-19 has not changed these priorities, the Department is focused on doing more with its existing resources and building back better. As current programs are adapted and a suite of new programming is launched, resource management practices and sound financial stewardship are key and center in ensuring successful delivery. Although recipients continue to experience constraints such as labour shortages and supply chain issues, INFC remains committed to provide funding to them in a timely fashion.
Finally, INFC is focusing its efforts on attracting and retaining employees with the skill sets and experience necessary to fulfil the department's evolving mandate, and on implementing additional flexibilities to allow provinces and territories more time for the completion of projects under several programs. For example, the ICIP COVID-19 stream has been extended to allow projects by provinces to be completed by December 31, 2023 and projects in the territories and in remote communities must be completed by December 31, 2024.
Approval by Senior Officials
Approved by:
Kelly Gillis
Deputy Head
Nathalie Bertrand
Chief Financial Officer
Signed at Ottawa, Canada
Office of Infrastructure Canada
Quarterly Financial Report
For the quarter ended December 31, 2022
Departmental budgetary expenditures by Standard Objects (unaudited)
(in thousands of dollars)
Fiscal year 2022-23
| N/A | Planned expenditures
for the year ending March 31, 2023 |
Expended during the
quarter ended December 31, 2022 |
Year-to-date used
at quarter-end |
|---|---|---|---|
| Expenditures: | |||
| Personnel | 144,936 | 38,681 | 106,664 |
| Transportation and communications | 1,190 | 607 | 997 |
| Information | 949 | 73 | 376 |
| Professional and special services | 64,389 | 20,982 | 40,665 |
| Rentals | 4,930 | 456 | 1,572 |
| Repair and maintenance | 15,044 | 4,556 | 11,664 |
| Utilities, materials and supplies | 98 | 56 | 87 |
| Acquisition of land, buildings and works | 11,206 | 1,792 | 4,723 |
| Acquisition of machinery and equipment | 3,040 | 470 | 1,456 |
| Transfer payments | 9,074,320 | 1,266,601 | 3,543,898 |
| Public debt charges | 53,580 | 10,653 | 28,462 |
| Other subsidies and payments | - | 1 | 4 |
| Total net budgetary expenditures | 9,373,684 | 1,344,927 | 3,740,568 |
Departmental budgetary expenditures by Standard Objects (unaudited)
(in thousands of dollars)
Fiscal year 2021-22
| N/A | Planned expenditures
for the year ending March 31, 2022 |
Expended during the
quarter ended December 31, 2021 |
Year-to-date used
at quarter-end |
|---|---|---|---|
| Expenditures: | |||
| Personnel | 103,742 | 25,680 | 71,461 |
| Transportation and communications | 1,907 | 175 | 581 |
| Information | 605 | 79 | 321 |
| Professional and special services | 54,658 | 5,862 | 31,493 |
| Rentals | 2,607 | 671 | 1,497 |
| Repair and maintenance | 41,616 | 4,227 | 11,101 |
| Utilities, materials and supplies | 340 | 11 | 21 |
| Acquisition of land, buildings and works | 151,365 | 1,673 | 4,417 |
| Acquisition of machinery and equipment | 2,344 | 699 | 828 |
| Transfer payments | 9,558,259 | 516,364 | 5,885,081 |
| Public debt charges | 40,483 | 10,771 | 28,768 |
| Other subsidies and payments | - | 0 | (1) |
| Total net budgetary expenditures | 9,957,925 | 566,212 | 6,035,568 |
Download
If the following document is not accessible to you, please contact info@infc.gc.ca for assistance.
- Departmental budgetary expenditures by Standard Objects (PDF version) (315.45 KB)
Office of Infrastructure Canada
Quarterly Financial Report
For the quarter ended December 31, 2022
Statement of Authorities (unaudited)
(in thousands of dollars)
Fiscal Year 2022-23
| N/A | Total available for use for the year ending March 31, 2022 |
Used during the quarter ended December 31, 2022 |
Year-to-date used at quarter-end |
|---|---|---|---|
| Vote 1 – Operating expenditures | 258,637 | 70,223 | 174,517 |
| Vote 5 – Capital expenditures | 21,713 | 3,373 | 7,962 |
| Vote 10 – Contributions | 6,805,354 | 558,530 | 1,701,345 |
| Budgetary Statutory Authorities | |||
| (S) – Contributions to employee benefit plans | 18,829 | 4,707 | 14,122 |
| (S) – Canada Community-Building Fund | 2,268,967 | 708,070 | 1,842,554 |
| (S) – Minister salary and car allowance | 185 | 23 | 69 |
| Total Budgetary Authorities | 9,373,684 | 1,344,927 | 3,740,568 |
| Non-Budgetary Authorities | - | - | - |
| Total Authorities | 9,373,684 | 1,344,927 | 3,740,568 |
Statement of Authorities (unaudited)
(in thousands of dollars)
Fiscal Year 2021-22
| N/A | Total available for use for the year ending March 31, 2022 |
Used during the quarter ended December 31, 2021 |
Year-to-date used at quarter-end |
|---|---|---|---|
| Vote 1 – Operating expenditures | 207,595 | 43,576 | 132,239 |
| Vote 5 – Capital expenditures | 176,927 | 3,614 | 10,262 |
| Vote 10 – Contributions | 5,068,176 | 516,364 | 1,394,998 |
| Budgetary Statutory Authorities | |||
| (S) – Contributions to employee benefit plans | 15,054 | 2,643 | 7,929 |
| (S) – Canada Community-Building Fund | 4,490,082 | - | 4,490,082 |
| (S) – Minister salary and car allowance | 91 | 15 | 56 |
| Total Budgetary Authorities | 9,957,925 | 566,212 | 6,035,568 |
| Non-Budgetary Authorities | - | - | - |
| Total Authorities | 9,957,925 | 566,212 | 6,035,568 |
Download
If the following document is not accessible to you, please contact info@infc.gc.ca for assistance.
- Statement of Authorities (PDF version) (311.13 KB)
Report a problem on this page
- Date modified: