
Quarterly Financial Report for the quarter ended June 30, 2021
Office of Infrastructure of Canada Quarterly Financial Report for the quarter ended June 30, 2021
Statement outlining results, risks and significant changes in operations, personnel and programs

Introduction
This quarterly report has been prepared by management as required by Section 65.1 of the Financial Administration Act and in the form and manner prescribed by the Treasury Board. This quarterly report should be read in conjunction with the Main Estimates as well as Budget 2021.
The key to building Canada for the 21st century is a strategic and collaborative long-term infrastructure plan that builds economically vibrant, strategically planned, sustainable and inclusive communities. Infrastructure Canada (INFC) works closely with all orders of government and other partners to enable investments in social, green, public transit and other core public infrastructure, as well as trade and transportation infrastructure.
Further information on INFC's mandate, responsibilities, and programs can be found in INFC's 2021-22 Main Estimates.
Basis of Presentation
This quarterly report has been prepared by management using an expenditure basis of accounting. The accompanying Statement of Authorities includes INFC's spending authorities granted by Parliament and those used by INFC consistent with the Main Estimates and Supplementary Estimates for the 2021-22 fiscal year (FY). This quarterly report has been prepared using a special purpose financial reporting framework designed to meet financial information needs with respect to the use of spending authorities.
The authority of Parliament is required before monies can be spent by the government. Approvals are given in the form of annually approved limits through Appropriation Acts or through legislation in the form of statutory spending authority for specific purposes.
INFC uses the full accrual method of accounting to prepare and present its annual departmental financial statements that are part of the departmental performance reporting process. However, the spending authorities voted by Parliament remain on an expenditure basis.
In the past, INFC has worked in collaboration with other federal departments and agencies to deliver some of its transfer payment programs (collectively known as federal delivery partners).
It should be noted that this quarterly report has not been subject to an external audit or review.
Highlights of Fiscal Quarter and Fiscal Year-to-Date Results
This section highlights the significant items that contributed to the change in resources available for use from 2020-21 to 2021-22 and in actual expenditures as of June 30, 2020 and June 30, 2021.
Authorities
Graph 1: Comparison of Authorities Available as of June 30, 2020 and June 30, 2021
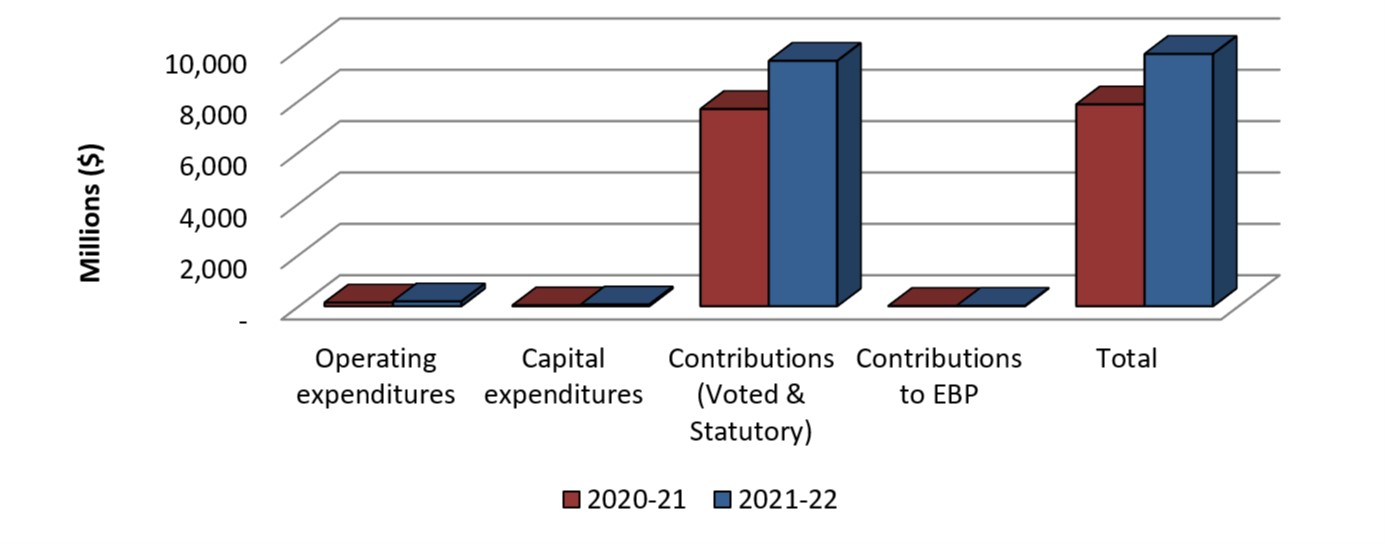
Text description of Graph 1
Graph 1: Comparison of Authorities Available as of June 30, 2020 and June 30, 2021.
Bar graph showing the comparison of authorities available for use as of June 30, 2020 and June 30, 2021.
- Operating authorities available as of Q1 2020-21 were $140.61 million, compared with $186.86 million as of Q1 2021-22.
- Capital authorities available as of Q1 2020-21were $32.59 million, compared with $66.23 million as of Q1 2021-22.
- Contribution (Voted and Statutory) authorities available as of Q1 2020-21 were $7.68 billion, compared with $9.56 billion as of Q1 2021-22.
- Contributions to the Employee Benefit Plan authorities available as of Q1 2020-21 were $7.76 million, compared with $15.05 million as of Q1 2021-22.
- The total of authorities available for use as of Q1 2020-21 were $7.86 billion, compared with $9.82 billion as of Q1 2021-22.
As shown in the Statement of Authorities, INFC's total authorities available for 2021-22 are $9.83 billion as of the end of Quarter 1 (Q1) and represent a $1.97 billion increase compared to the same quarter in the prior year (PY).
This increase is summarized in the table below:
|
Authorities |
Increase/(Decrease) vs. Prior Year-to-date (000's) |
% Change vs. prior year |
|---|---|---|
|
Operating Expenditures |
46,246 |
32.9% |
|
Capital Expenditures |
33,643 |
103.2% |
|
Contributions (Voted and Statutory) |
1,878,663 |
24.5% |
|
Contributions to Employee Benefit Plans (EBP) |
7,297 |
94.1% |
The sources of significant year-over-year changes are summarized as follows:
- Operating Expenditures – This increase is mainly due to funding received to sustain departmental operations from the Program Integrity Treasury Board submission – Strengthen Stewardship of Canadian Infrastructure: Long-Term Resourcing Strategy, as well as new Operating funding required to deliver on three new Programs: Funding to Improve Ventilation in Public Buildings, Green and Inclusive Community Buildings Program and Permanent Public Transit Fund.
- Capital Expenditures – This increase is tied to legal obligations from past property transactions for the Gordie Howe International Bridge project.
- Contributions (Voted and Statutory) – This increase is mainly due to the top up to the Canada Community-Building Fund (CCBF) previously named Gas Tax Fund.
- Contributions to Employee Benefit Plans – This increase is reflective of the growth in full time equivalents (FTEs) associated with the new Programs listed in the Operating Expenditures section.
Expenditure Analysis
Expenditures at the end of Q1 were $2.59 billion, compared to $2.35 billion reported in the same period of 2020-21, representing an increase of 10% between Q1 of the two years. The source of the relative increase is demonstrated in the tables, graphs and analysis below.
Graph 2: Comparison of Total Expenditures as of June 30, 2020 and June 30, 2021
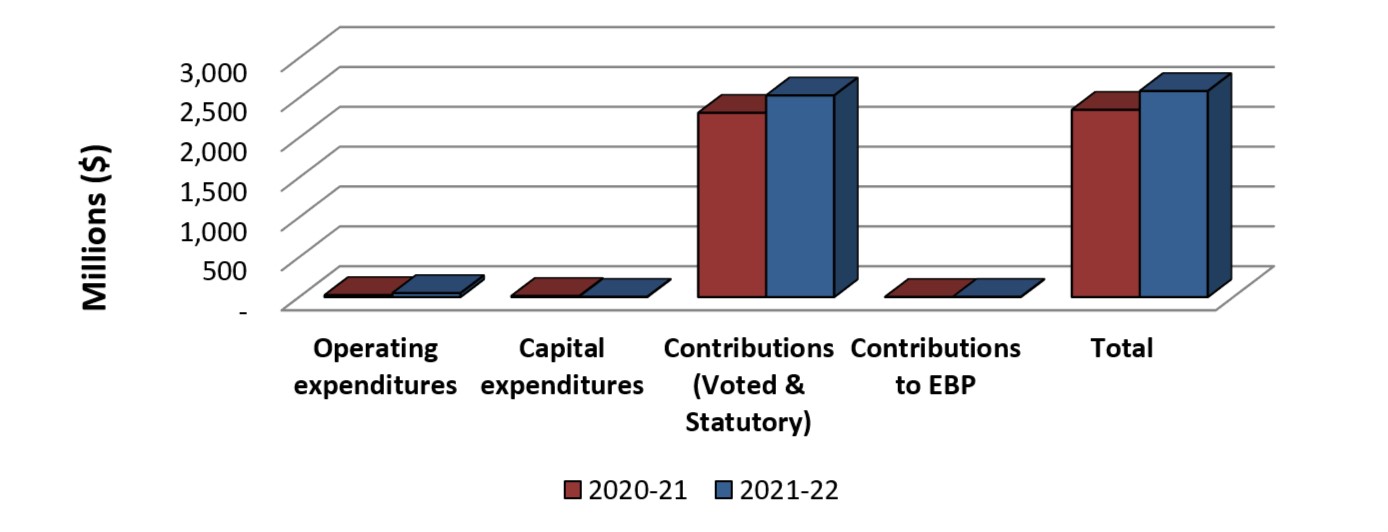
Text description of Graph 2
Graph 2: Comparison of Total Expenditures as of June 30, 2020 and June 30, 2021.
Bar graph showing the comparison of total expenditures used year-to-date as of June 30, 2020 and June 30, 2021.
- Authorities used for Operating as of Q1 2020-21 were $24.09 million, compared with $49.74 million as of Q1 2021-22.
- Authorities used for Capital as of Q1 2020-21 were $13.17 million, compared with $3.18 million as of Q1 2021-22.
- Authorities used for Contributions (Voted and Statutory) as of Q1 2020-21 were $2.31 billion compared with $2.53 billion as of Q1 2021-22.
- Authorities used for Contributions to the Employee Benefit Plan as of Q1 2020-21 were $1.29 million, compared with $2.64 million as of Q1 2021-22.
- Total year-to-date budgetary expenditures as of Q1 2020-21 were $2.35 billion, compared to $2.58 billion as of Q1 2021-22.
|
Year-to-date expenditures |
Increase/(Decrease) vs. Prior Year-to-date (000's) |
% Change vs. prior year |
|---|---|---|
|
Operating Expenditures |
25,648 |
106.5% |
|
Capital Expenditures |
(9,988) |
(75.8%) |
|
Contributions (Voted and Statutory) |
218,371 |
9.4% |
|
Contributions to Employee Benefit Plans |
1,350 |
104.4% |
The sources of significant year-over-year changes are summarized as follows:
- Operating and Capital Expenditures – Further details are provided later in this report, by standard object.
- Contributions (Voted and Statutory) – Further details by program are provided below.
- Contributions to Employee Benefit Plans – The increase in INFC's contribution to the Employee Benefit Plan is directly attributable to an increase in the number of full-time equivalents (FTEs) currently employed at INFC.
Graph 3: Comparison of Authorities Used for Contributions as of June 30, 2020 and June 30, 2021
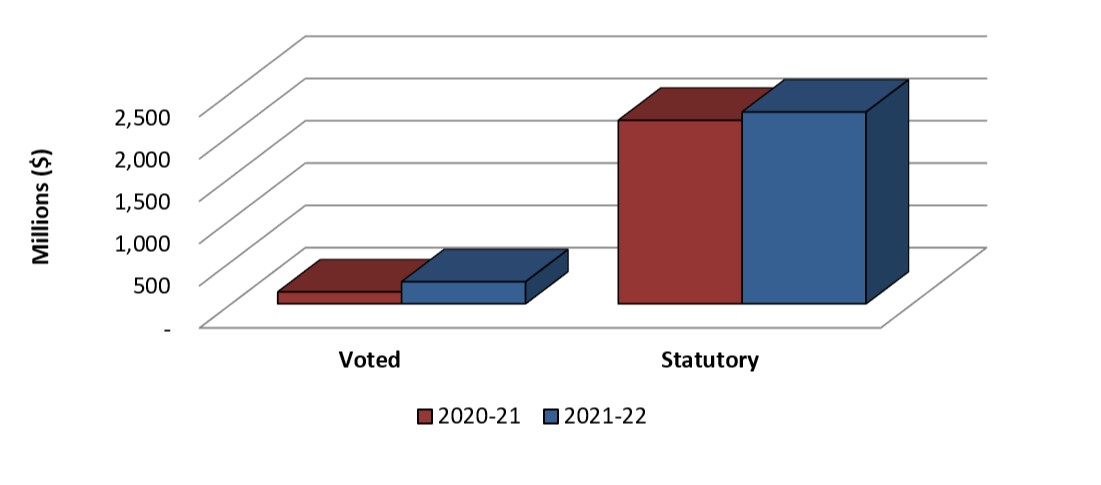
Text description of Graph 3
Graph 3: Comparison of Authorities Used for Contributions as of June 30, 2020 and June 30, 2021
Bar graph showing the comparison of authorities used for Contributions (Voted) and Contributions (Statutory) as of June 30, 2020 and June 30, 2021.
- Contributions (Voted) expensed as of Q1 2020-21 were $141.17 million, compared with $260.89 million as of Q1 2021-22.
- Contributions (Statutory) expensed as of Q1 2020-21 were $2.17 billion, compared with $2.27 billion as of Q1 2021-22.
Significant changes in year-to-date contribution expenditures between June 2020 and June 2021 were as follows:
|
Program Fund |
Increase/(Decrease) vs. Prior Year-to-date (000's) |
% Change vs. prior year |
|---|---|---|
|
Canada Community-Building Fund (CCBF) - Statutory |
98,651 |
5% |
|
Building Canada Fund-Major Infrastructure Component (BCF-MIC) |
63,344 |
N/A |
|
Public Transit Infrastructure Fund (PTIF) |
58,319 |
2376% |
|
New Building Canada Fund-National Infrastructure Component (NBCF-NIC) |
17,471 |
322% |
|
Green Infrastructure Fund (GIF) |
13,645 |
1336% |
|
Clean Water Wastewater Fund (CWWF) |
12,487 |
304% |
|
Canada Healthy Communities Initiative (CHCI) |
11,556 |
N/A |
|
New Building Canada Fund-Provincial-Territorial Infrastructure Component-Small Communities Fund (NBCF-PTIC-SCF) |
11,528 |
140% |
|
Investing in Canada Infrastructure Program (ICIP): COVID-19 Resilience Stream |
10,067 |
N/A |
|
New Building Canada Fund-Provincial-Territorial Infrastructure Component-National and Regional Projects (NBCF-PTIC-NRP) |
(48,098) |
(60%) |
The sources of significant year-over-year changes are summarized as follows:
- CCBF – Similar to 2020, the Canada Community-Building Fund (previously named as Gas Tax Fund) was accelerated this year and provided in a single payment in June to help Canadian communities recover from the COVID-19 pandemic as quickly as possible while respecting public health guidelines. As the allocation is indexed, the FY 2021-22 allocation was $2.27 billion, which is 5% higher than FY 2020-21.
- BCF-MIC – An advance payment was sent to Transport Canada in the amount of $63.3 million for agreements managed on behalf of Infrastructure Canada.
- PTIF – In the next two years a significant number of projects are expected to be completed. To date Québec, Ontario, British Columbia and Manitoba have submitted $60.7 million in claims.
- NBCF-NIC – All the contribution agreements in this program have now been signed. Many of the projects are under implementation which is contributing to claims being higher than the previous year.
- GIF- Claims are higher than last year as many projects are advancing in their implementation.
- CWWF – A significant number of projects are expected to be completed in the next two years. To date Québec, New Brunswick, Nova Scotia and Prince Edward Island have submitted $16.6 million in claims.
- CHCI – The entire forecasted amount for this year has been claimed in Q1. No other claims will be submitted in FY 2021-22.
- NBCF-PTIC-SCF – A significant number of projects are expected to be completed in the next three years. As many of the projects are under implementation the claims are higher compared to last year.
- COVID-19-Resilience Stream ICIP – To date Québec submitted $10 million in claims. More claims are forecasted to be received in FY 2021-22.
- NBCF-PTIC-NRP – Fewer claims were received and processed by the end of Q1 2021-22, compared to 2020-21.
Departmental Budgetary Expenditures by Standard Object
The planned Departmental Budgetary Expenditures by Standard Object are set out in the table at the end of this report. Aggregate year-to-date expenditures in 2021-22 increased by $235.4 million, compared with the same quarter last year. The largest single factor was an increase in transfer payments as explained above.
A breakdown of variances in year-to-date spending by standard object is below:
|
Changes to Expenditures by Standard Object |
Increase/(Decrease) vs. Prior Year-to-date (000's) |
% Change vs. prior year |
|---|---|---|
|
Transfer payments |
218,371 |
9.4% |
|
Professional and special services |
10,866 |
89.2% |
|
Public debt charges |
7,202 |
N/A |
|
Personnel |
4,638 |
28.2% |
|
Repair and maintenance |
1,507 |
146.4% |
|
Information |
81 |
423.8% |
|
Rentals |
53 |
14.1% |
|
Transportation and Communication |
13 |
73.4% |
|
Utilities, materials and supplies |
(5) |
(51.3%) |
|
Acquisition of machinery and equipment |
(149) |
(76.8) |
|
Acquisition of land, buildings and works |
(3,507) |
(76.2%) |
|
Other subsidies and payments |
(3,690) |
(100%) |
The sources of significant year-over-year changes are summarized as follows:
- Transfer payments – Details were previously discussed.
- Professional and special services – The increase is mainly due to an increase in engineering costs related to payments for the Réseau Express Métropolitain (REM) project which will be reimbursed based on an agreement between REM Inc. and INFC.
- Public debt charges – The increase is explained by an interest expense payment made for the Samuel De Champlain Bridge Corridor (SDCBC). These payments were previously coded under Other subsidies and payments.
- Personnel – Increase in the number of employees.
- Repair and maintenance – The increase is mainly related to SDCBC as the project is in the Operating and Maintenance phase.
- Acquisition of land, buildings and work – The decrease is related to the monthly capital payment made for the SDCBC project. The capital portion of the monthly payment was higher at the beginning of the year in 2020-21, but was later adjusted based on the Present Value calculation table – a new approach that was recommended by the Office of the Comptroller General.
- Other subsidies and payments – The interest expense payment made for the SDCBC project was reported under this standard object in 2020-21. As per Receiver General recommendation, interest payment for SDCBC are now coded under Public debt charges.
Overall, INFC has spent 26.3% of its current Total Authorities as of June 30, 2021, compared to 29.9% at the end of Q1 of the previous fiscal year.
Risks and Uncertainties
In most cases, INFC funds projects via a Contribution Agreement or Integrated Bilateral Agreement between Canada and a Provincial/Territorial (PTs) government. PTs governments then enter into their own agreements with municipalities, who are ultimately responsible for project management and construction of the infrastructure.
Most of INFC's programs are structured in such a way that funding flows from the Department based on requests for reimbursements. It is important to note that federal spending is not an accurate measure of when the economic activity created by infrastructure spending occurs. When projects are approved, work begins and economic activity is generated by provinces, territories and municipalities, which are responsible for implementing projects and incurring costs. INFC makes the federal contribution only when requested by partners.
There are a variety of reasons that can affect the timing of requests for reimbursements, which can contribute to a variance between planned spending and actual spending. Some projects, once approved, move quickly into the construction phase while others have longer lead times for planning, and local approval processes (e.g. zoning and permitting). Regardless of how long planning takes or how soon ground can break, eligible costs can be submitted for reimbursement throughout the life of the project.
INFC encourages PTs to submit claims in a timely manner to ensure the flow of funding as planned. Parliamentary authority to spend typically expires at the end of the fiscal year; however, in response to the needs of its project partners, INFC reprofiles its authorities as needed so that the funding committed to specific projects continues to be available in future years when needed.
In addition, INFC has worked with provinces and territories to introduce improvements to the flow of funding processes to better align authorities of existing programs to expenditures and improve predictability of high materiality projects. It also used lessons learned from legacy programs to introduce additional flexibilities in the design of new programs such as flexibility in funding mechanism and basis of payments. These efforts should yield important impacts over the coming years.
INFC is committed to making infrastructure investments that support economic growth and job creation, help combat the effects of climate change, and build inclusive communities. While COVID-19 has not changed these priorities, the Department is focused on doing more with its existing resources and building back better. As current programs are adapted and a suite of new programming is launched, resource management practices and sound financial stewardship are key and center in ensuring successful delivery. Although recipients continue to experience constraints resulting from COVID-19 which affect the implementation of new projects, INFC is committed to provide funding to them in a timely fashion.
Therefore INFC is focusing efforts on attracting and retaining employees with the skill sets and experience necessary to fulfil the department's evolving mandate, and on implementing additional flexibilities to allow provinces and territories more time for the completion of projects under several programs. For example, the ICIP COVID-19 stream has been extended to allow projects by provinces to be completed by December 31st, 2023 and projects in the territories and in remote communities must be completed by December 31st, 2024.
Significant Changes in Relation to Operations, Personnel and Programs
Infrastructure Canada continues to grow and evolve. Since the last Quarterly Financial Report, the following significant changes have taken place within the department:
- INFC secured 5 years of public transit funding to build the foundation and deliver on $14.9 billion of public transit projects over the next eight years, which includes permanent funding of $3 billion per year currently in the fiscal framework for Canadian communities beginning in 2026-27.
- INFC secured $1.5 billion over the next 5 years to deliver on the Green and Inclusive Community Buildings (GICB) program aims to build more community buildings and improve existing ones – in particular in areas with populations experiencing higher needs – while also making the buildings more energy efficient, lower carbon, more resilient, and higher performing. The program will support green and accessible retrofits, repairs or upgrades of existing public community buildings and the construction of new publicly-accessible community buildings that serve high-needs, underserved communities across Canada.
- INFC secured $120 million over 2 years that will be added to the provincial and territorial agreements of the Investing in Canada Infrastructure Program to support ventilation improvement projects in public buildings.
Approval by Senior Officials
Approved by:
Kelly Gillis
Deputy Head
Nathalie Bertrand
Chief Financial Officer
Office of Infrastructure Canada
Quarterly Financial Report
For the quarter ended June 30, 2021
Departmental budgetary expenditures by Standard Objects (unaudited)
(in thousands of dollars)
Fiscal year 2021-22
| N/A | Planned expenditures
for the year ending March 31, 2021 |
Expended during the
quarter ended June 30, 2021 |
Year-to-date used
at quarter-end |
|---|---|---|---|
| Expenditures: | |||
| Personnel | 103,182 | 21,072 | 21,072 |
| Transportation and communications | 1,672 | 32 | 32 |
| Information | 530 | 100 | 100 |
| Professional and special services | 45,169 | 23,053 | 23,053 |
| Rentals | 2,286 | 430 | 430 |
| Repair and maintenance | 41,616 | 2,537 | 2,537 |
| Utilities, materials and supplies | 298 | 5 | 5 |
| Acquisition of land, buildings and works | 40,671 | 1,094 | 1,094 |
| Acquisition of machinery and equipment | 2,344 | 45 | 45 |
| Transfer payments | 9,558,259 | 2,529,861 | 2,529,861 |
| Public debt charges | 30,379 | 7,202 | 7,202 |
| Other subsidies and payments | - | - | - |
| Total net budgetary expenditures | 9,826,406 | 2,585,431 | 2,585,431 |
Departmental budgetary expenditures by Standard Objects (unaudited)
(in thousands of dollars)
Fiscal year 2020-21
| N/A | Planned expenditures
for the year ending March 31, 2020 |
Expended during the
quarter ended June 30, 2020 |
Year-to-date used
at quarter-end |
|---|---|---|---|
| Expenditures: | |||
| Personnel | 60,260 | 16,434 | 16,434 |
| Transportation and communications | 1,563 | 18 | 18 |
| Information | 659 | 19 | 19 |
| Professional and special services | 36,099 | 12,186 | 12,186 |
| Rentals | 1,494 | 377 | 377 |
| Repair and maintenance | 46,238 | 1,030 | 1,030 |
| Utilities, materials and supplies | 163 | 10 | 10 |
| Acquisition of land, buildings and works | 4,602 | 4,602 | 4,602 |
| Acquisition of machinery and equipment | 3,048 | 194 | 194 |
| Transfer payments | 7,679,596 | 2,311,490 | 2,311,490 |
| Public debt charges | - | - | - |
| Other subsidies and payments | 26,835 | 3,690 | 3,690 |
| Total net budgetary expenditures | 7,860,557 | 2,350,050 | 2,350,050 |
Download
If the following document is not accessible to you, please contact infc.info.infc@canada.ca for assistance.
- Departmental budgetary expenditures by Standard Objects (PDF version) (7.26 KB)
Office of Infrastructure Canada
Quarterly Financial Report
For the quarter ended June 30, 2021
Statement of Authorities (unaudited)
(in thousands of dollars)
Fiscal Year 2021-22
| N/A | Total available for use for the year ending March 31, 2021 |
Used during the quarter ended June 30, 2021 |
Year-to-date used at quarter-end |
|---|---|---|---|
| Vote 1 – Operating expenditures | 186,769 | 49,718 | 49,718 |
| Vote 5 – Capital expenditures | 66,233 | 3,186 | 3,186 |
| Vote 10 – Contributions | 5,068,176 | 260,894 | 260,894 |
| Budgetary Statutory Authorities | |||
| (S) – Contributions to employee benefit plans | 15,054 | 2,643 | 2,643 |
| (S) – Canada Community-Building Fund | 4,490,083 | 2,268,967 | 2,268,967 |
| (S) – Municipal Asset Management Program | - | - | - |
| (S) – Minister salary and car allowance | 91 | 23 | 23 |
| Total Budgetary Authorities | 9,826,406 | 2,585,431 | 2,585,431 |
| Non-Budgetary Authorities | - | - | - |
| Total Authorities | 9,826,406 | 2,585,431 | 2,585,431 |
Statement of Authorities (unaudited)
(in thousands of dollars)
Fiscal Year 2020-21
| N/A | Total available for use for the year ending March 31, 2020 |
Used during the quarter ended June 30, 2020 |
Year-to-date used at quarter-end |
|---|---|---|---|
| Vote 1 – Operating expenditures | 140,525 | 24,085 | 24,085 |
| Vote 5 – Capital expenditures | 32,590 | 13,174 | 13,174 |
| Vote 10 – Contributions | 5,509,280 | 141,174 | 141,174 |
| Budgetary Statutory Authorities | |||
| (S) – Contributions to employee benefit plans | 7,757 | 1,293 | 1,293 |
| (S) – Canada Community-Building Fund | 2,170,316 | 2,170,316 | 2,170,316 |
| (S) – Municipal Asset Management Program | - | - | - |
| (S) – Minister salary and car allowance | 89 | 8 | 8 |
| Total Budgetary Authorities | 7,860,557 | 2,350,050 | 2,350,050 |
| Non-Budgetary Authorities | - | - | - |
| Total Authorities | 7,860,557 | 2,350,050 | 2,350,050 |
Download
If the following document is not accessible to you, please contact infc.info.infc@canada.ca for assistance.
- Statement of Authorities (PDF version) (6.97 KB)
Report a problem on this page
- Date modified: