
Homelessness data snapshot: Analysis of chronic homelessness among shelter users in Canada 2017 - 2021
Homelessness data snapshot: Analysis of chronic homelessness among shelter users in Canada 2017 - 2021
On this page
- Introduction
- Data
- Research findings
- Demographic analysis
- Key findings
- For more information
- Annex: Comparison of acute chronicity and prolonged instability within each population
Introduction
Chronic homelessness generally refers to long periods of homelessness that are associated with greater risks of harm and difficulty accessing stable housing. For many communities, preventing and reducing chronic homelessness is a priority.
This report provides an estimate and overview of chronic homelessness in Canada between 2017 and 2021. It also includes a demographic analysis of chronic homelessness in 2021, identifying the relative prevalence across specific populations.
Data
The national definition of chronic homelessness is inclusive of experiences of homelessness that occur in sheltered and unsheltered areas, as well as experiences of hidden homelessness. It includes individuals who are currently experiencing homelessness and who meet at least one of the following criteria:
- They have a total of at least six months (180 days) of homelessness over the past year, or
- They have recurrent experiences of homelessness over the past three years, with a cumulative duration of at least 18 months (546 days).
To estimate chronic homelessness at a national level, an indicator is used based on shelter use patterns. While this excludes experiences of homelessness that occur outside of the shelter systemFootnote 1, shelter use is the most consistent and reliable source of data available for analyzing homelessness trends over time. The indicator identifies emergency shelter users as experiencing chronic homelessness if they meet at least one of the following criteria:
- Acute chronicity: used a shelter for six months (180 days) or more in the past year, or
- Prolonged instability: accessed shelters at least once in each of the last three years.
Acute chronicity can be characterized as the experience of recent, persistent homelessness, whereas prolonged instability can be characterized as a longer-term lack of stable housing and repeated or prolonged homelessness. Some individuals exhibit both persistent homelessness within the past year, and recurrent returns to homelessness over the past three years. This exposure to both acute and repeated experiences of protracted homelessness is referred to as combined chronic homelessness.
Therefore, the indicator is able to categorize each shelter user into one of four distinct groups:
- Acute chronicity only,
- Prolonged instability only,
- Combined chronic homelessness (both acute chronicity and prolonged instability), and
- Not chronically homeless.
The national chronic homelessness indicator is calculated using data from communities that have complete coverage of their permanent emergency shelter system for three consecutive years, and annual estimates of national shelter use from the National Shelter Study. The data are collected by service providers and communities using the Homeless Individuals and Families Information System (HIFIS) and through data-sharing partnerships with jurisdictions that use similar systems.
The sample used to estimate chronic homelessness varies annually as the set of communities that meet the eligibility criteria changes. In 2021, the sample included 17 communities that satisfied the data requirements, representing 39.4% of national emergency shelter capacity. This is lower than in 2020 (40.3%, 17 communities), 2019 (48.8%, 16 communities), and 2018 (47.0%, 21 communities), but higher than in 2017 (38.5%, 22 communities). While this sample represents a significant portion of shelter user experiences, there may be some regional trends that are not captured as a result.
Research findings
In 2021, an estimated 93,529 people in Canada experienced homelessness at an emergency shelter. According to the National Shelter Study 2021 Update, the number of shelter users has been trending downwards since 2005. This drop was more pronounced in 2020, the first year of the pandemic, when shelter users decreased by 25.6%. Between 2020 and 2021, the number of shelter users increased by 5.9% as some emergency bed capacity recovered.
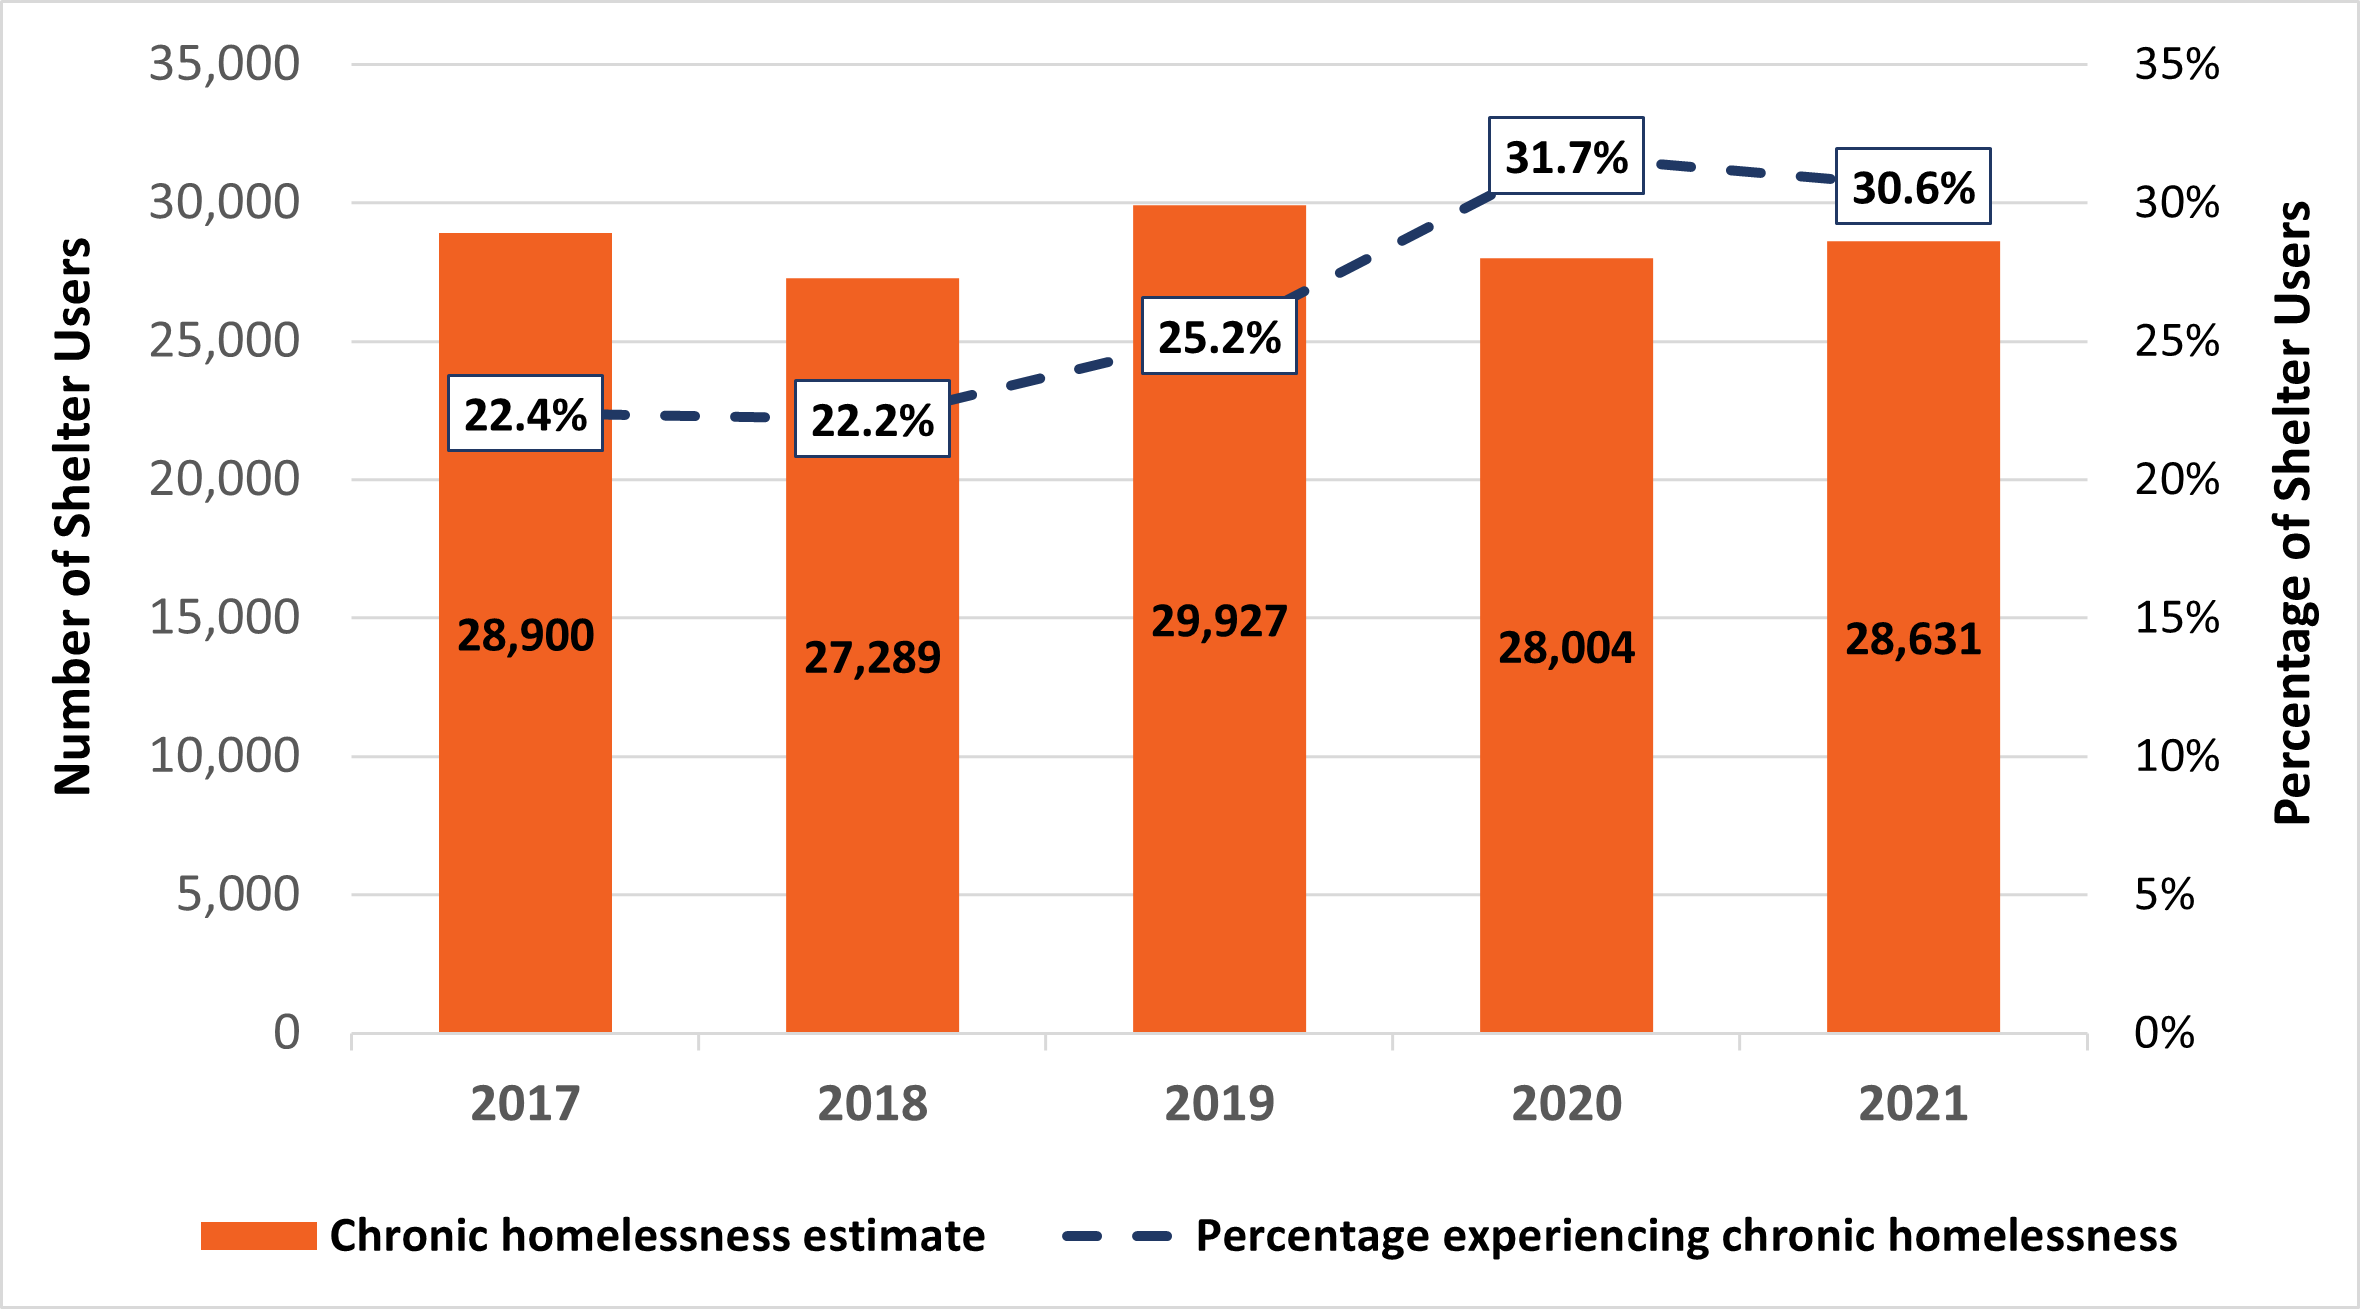
In 2021, an estimated 28,631 (30.6%) people experienced chronic homelessness. This represents an increase in the proportion of shelter users identified as chronically homeless from 2017 (22.4%) (Figure 1). Despite this proportional increase, the estimated number of chronically homeless shelter users has remained relatively stable from 2017 (28,900) to 2021 (28,631), mainly due to the overall decrease in shelter users between 2017 (129,017) and 2021 (93,529).
The decrease in shelter use may be partially attributed to a 20.5% drop in shelter capacity between 2019 and 2020 as homelessness services adapted to allow for physical distancing during the COVID-19 pandemic. The overall system capacity had largely recovered by 2021. By the end of that year, capacity was only 1.5% lower than it was in 2019.
Figure 1: Chronic homelessness from 2017 to 2021
-
Figure 1 - Text version
Chronic homelessness from 2017 to 2021 Year
Percentage experiencing chronic homelessness
Chronic homelessness estimate
2017
22.4%
28,900
2018
22.2%
27,289
2019
25.2%
29,927
2020
31.7%
28,004
2021
30.6%
28,631
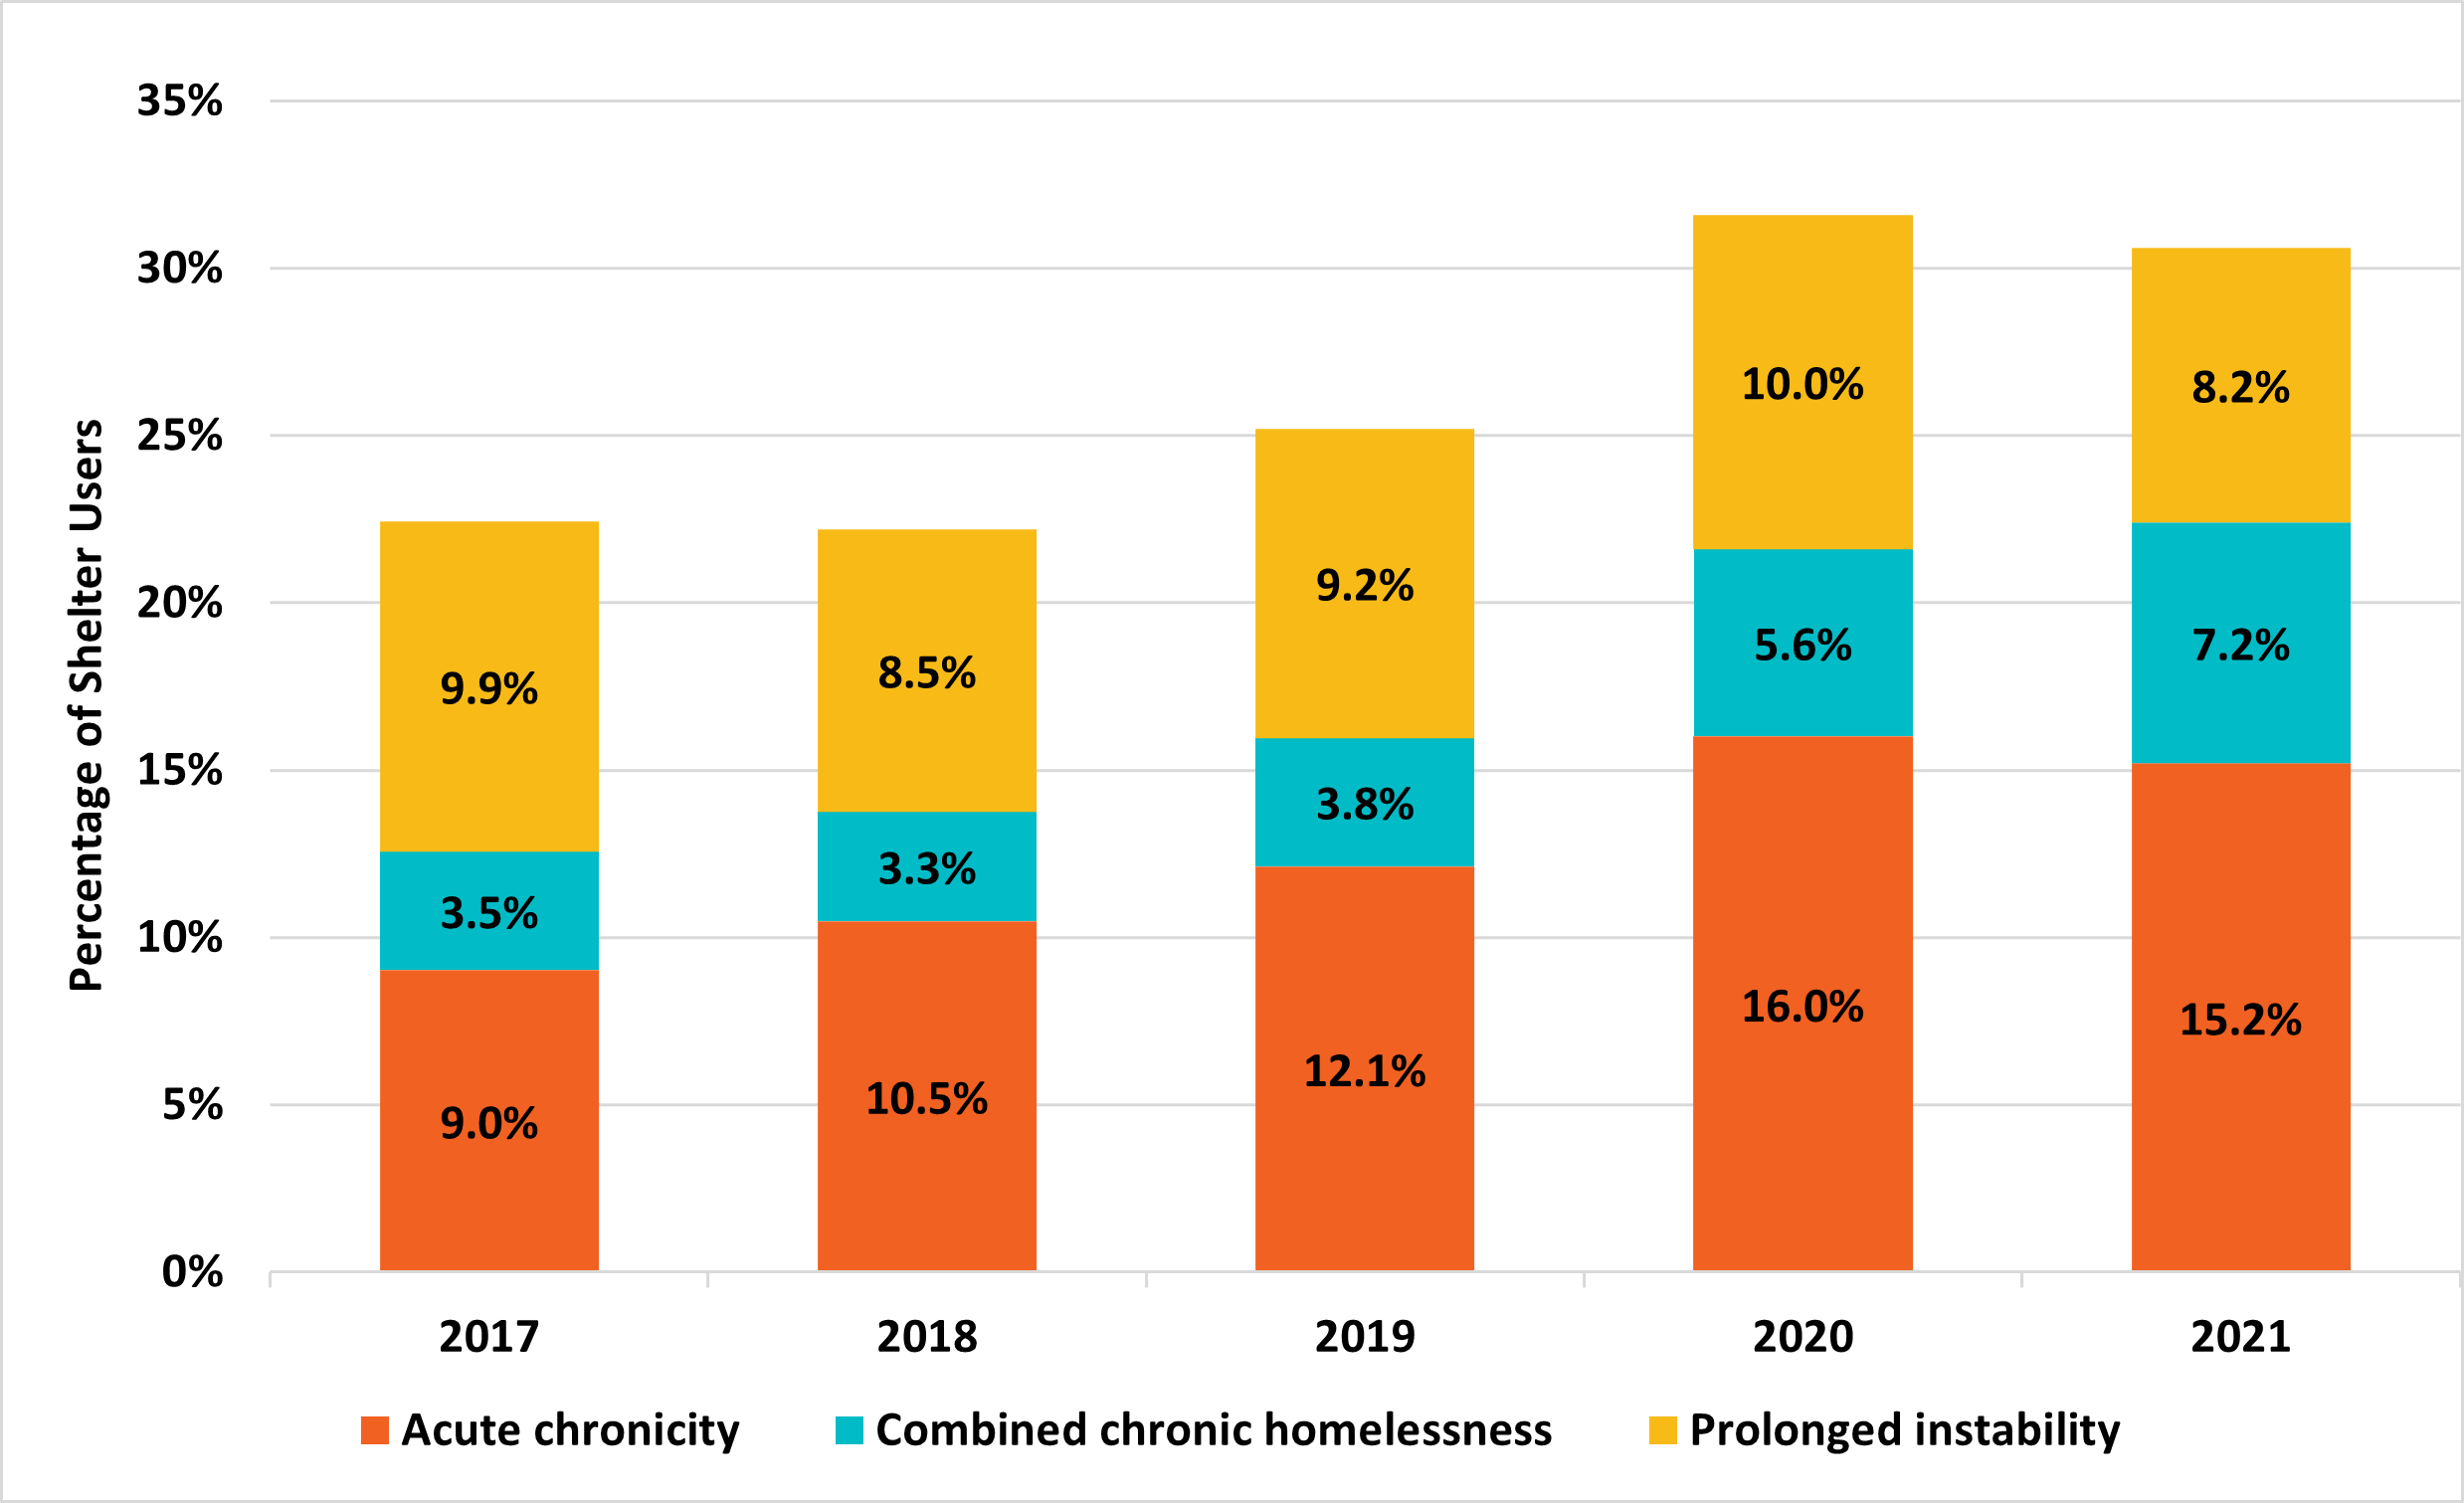
The overall chronic homelessness estimate includes three categories of shelter users: those who meet the acute chronicity criterion, those who meet the prolonged instability criterion, and those who meet both criteria. Between 2017 and 2021, different trends were seen for these three chronic homelessness categories (Figure 2).
- The prevalence of shelter users experiencing acute chronicity increased steadily from 2017 to 2020, and then remained relatively stable in 2021, dropping slightly from 16.0% to 15.2%.
- The prevalence of shelter users experiencing prolonged instability remained relatively stable from 2017 to 2020, then decreased in 2021, dropping from 10.0% to 8.2%.
- The prevalence of shelter users who experienced combined chronic homelessness was relatively stable between 2017 and 2019, then increased to 5.6% in 2020 and to 7.2% in 2021.
- In recent years, shelter users facing acute chronicity were most likely to comprise the largest proportion of the chronically homeless population, followed by those facing prolonged instability. Combined chronic homelessness tended to represent the smallest category of shelter users over this period.
Figure 2: Acute chronicity and prolonged instability from 2017 to 2021
-
Figure 2 - Text version
Acute chronicity and prolonged instability from 2017 to 2021 Year
Acute chronicity
Combined chronic homelessness
Prolonged instability
Total chronic homelessnessFootnote 2
2017
9.0%
3.5%
9.9%
22.4%
2018
10.5%
3.3%
8.5%
22.2%
2019
12.1%
3.8%
9.2%
25.2%
2020
16.0%
5.6%
10.0%
31.7%
2021
15.2%
7.2%
8.2%
30.6%
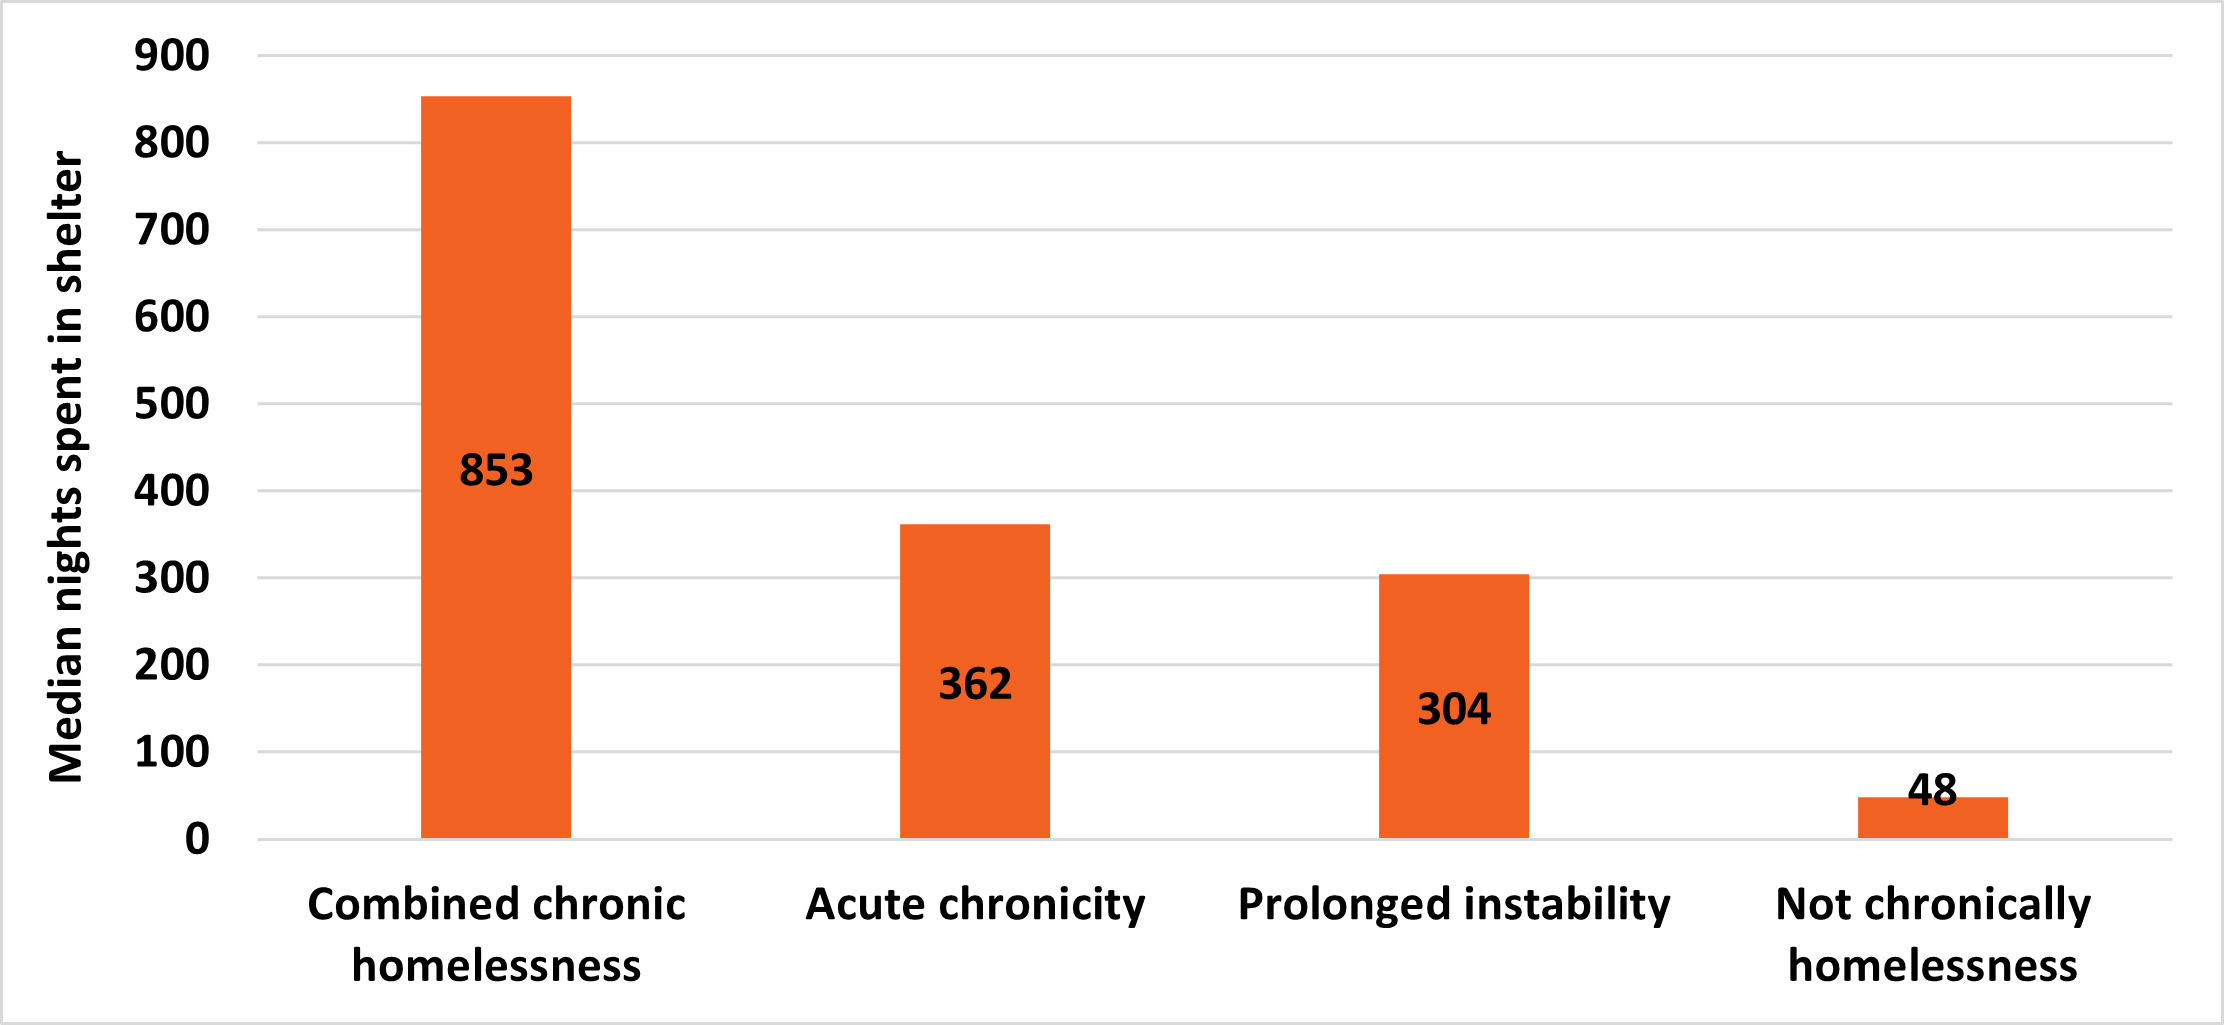
To better understand how chronic homelessness impacts individuals over a longer timescale, shelter use patterns were examined over a 12-year period, from 2010 to 2021, for each chronic homelessness group in 2021 (Figure 3).
- Those who experienced combined chronic homelessness (meeting both criteria) also tended to spend more nights in shelter overall. The median number of nights spent in shelter from 2010 to 2021 was 853 nights, which was more than twice that of any other group over this period.
- Those who experienced acute chronicity spent a median of 362 nights in shelter from 2010 to 2021.
- Those experiencing prolonged instability, spent a median of 304 nights in shelter from 2010 to 2021.
- For comparison, shelter users that did not meet any of the criteria for chronic homelessness spent a median of 48 nights in shelter from 2010 to 2021.
It is notable that the indicator for prolonged instability requires only one stay in shelter per year over three consecutive years, yet the median nights in shelter for this group still exceeds 300. The difference between the minimum requirement and the median for this group suggests that they tend to experience persistent multi-year housing insecurity.
Figure 3: Median nights spent in shelter from 2010 to 2021
-
Figure 3 - Text version
Median nights spent in shelter from 2010 to 2021 Chronic status
Median nights spent in shelter
Combined chronic homelessness
853
Acute chronicity
362
Prolonged instability
304
Not chronically homelessness
48
Demographic analysis
Age and chronic homelessness
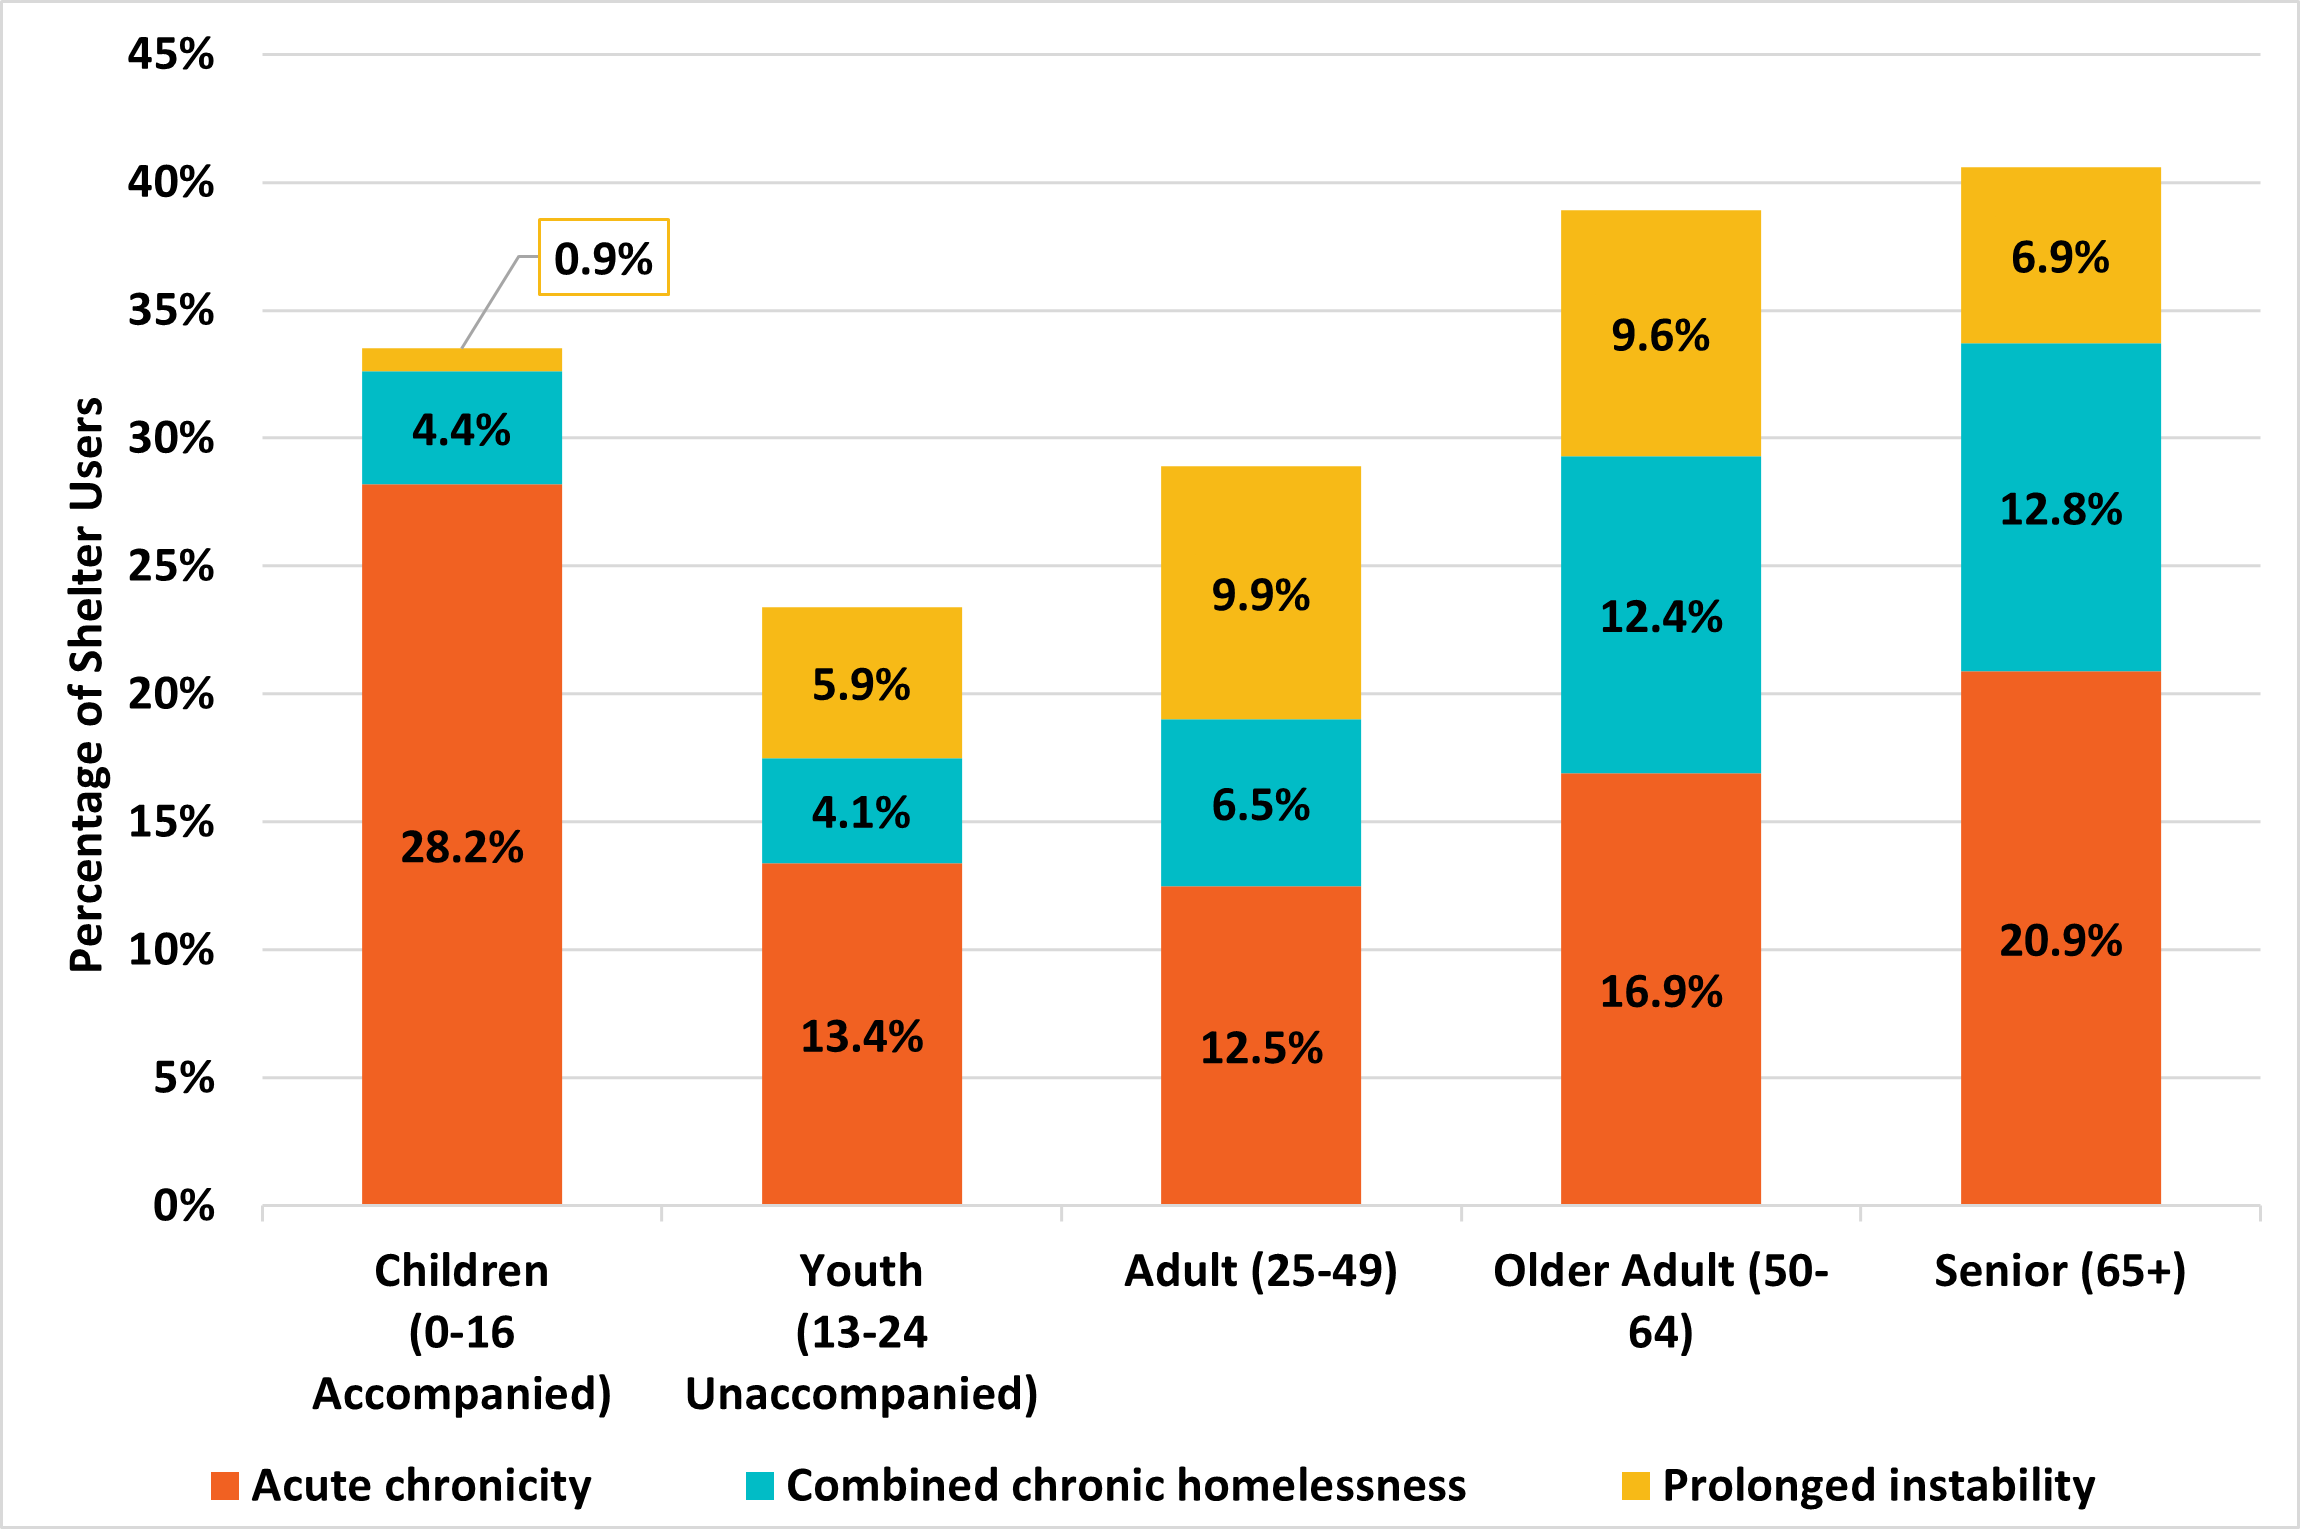
Rates of chronic homelessness differed across age groups: 33.6% of children (0-16 accompanied), 23.4% of youth (13-24 unaccompanied), 28.9% of adults (25-49), 38.9% of older adults (50-64), and 40.6% of seniors (65+).
Statistically significant differences were found in patterns of acute chronicity and prolonged instability by different age groups (Figure 4).
- Accompanied children (0-16) were most likely to experience acute chronicity, and very few experienced prolonged instability.
- Youth (13-24) were least likely to experience any type of chronic homelessness.
- Older adults (50-64) were more likely than youth (13-24) and adults (25-49) to experience all of the three distinct groups of chronic homelessness, especially combined chronic homelessness.
- Seniors (65+) were more likely than youth (13-24), adults (25-49) and older adults (50-64) to experience either acute chronicity or combined chronic homelessness.
Figure 4: Acute chronicity and prolonged instability by age in 2021
-
Figure 4 - Text version
Acute chronicity and prolonged instability by age in 2021 Age group
Acute chronicity
Combined chronic homelessness
Prolonged instability
Total chronic homelessnessFootnote 2
Children
(0-16 Accompanied)28.2%
4.4%
0.9%
33.6%
Youth
(13-24 Unaccompanied)13.4%
4.1%
5.9%
23.4%
Adult (25-49)
12.5%
6.5%
9.9%
28.9%
Older Adult (50-64)
16.9%
12.4%
9.6%
38.9%
Senior (65+)
20.9%
12.8%
6.9%
40.6%
Rates of chronic homelessness among shelter users tended to increase with age. As shown in the figure, older adults (50-64) and seniors (65+) had higher rates of chronic homelessness compared to adults (25-49) and unaccompanied youth (13-24). Accompanied children (0-16) also experienced high rates of chronic homelessness, which may be due to longer stays in family shelters.
Gender and chronic homelessness
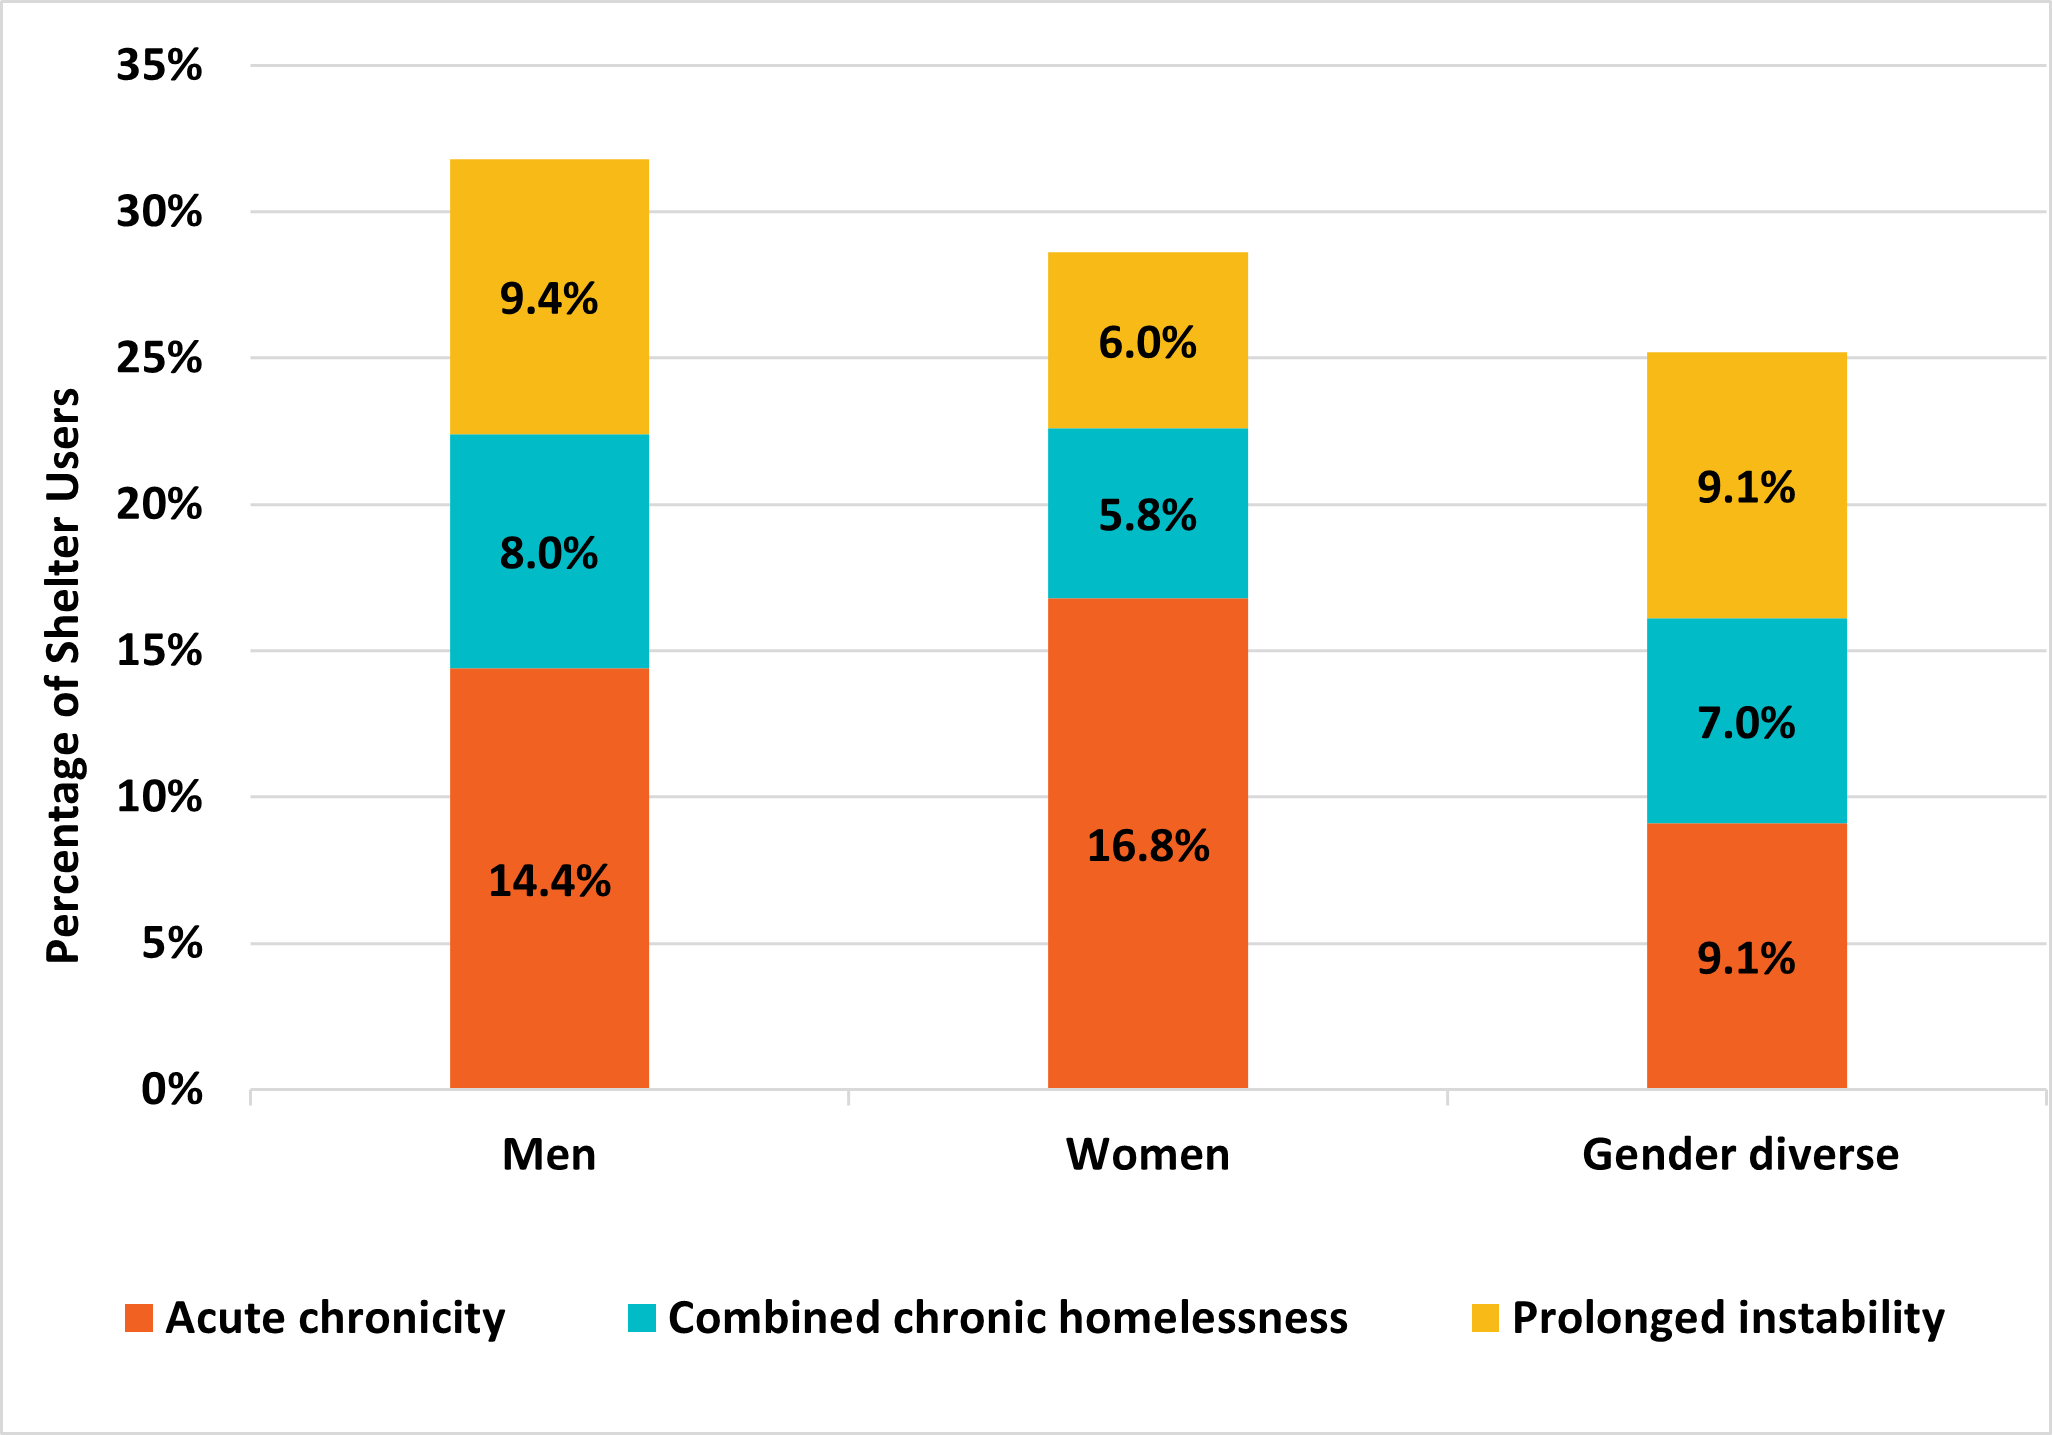
Rates of chronic homelessness also differed across gender groups: 31.9% of men, 28.7% of women, and 25.2% of gender diverse shelter users experienced chronic homelessness.
Statistically significant differences can be seen in patterns of acute chronicity and prolonged instability by different gender groups (Figure 5).
- Men were most likely to experience prolonged instability and combined chronic homelessness.
- Women had a higher rate of acute chronicity.
Figure 5: Acute chronicity and prolonged instability by gender in 2021
-
Figure 5 - Text version
Acute chronicity and prolonged instability by gender in 2021 Gender Group
Acute chronicity
Combined chronic homelessness
Prolonged instability
Total chronic homelessnessFootnote 2
Men
14.4%
8.0%
9.4%
31.9%
Women
16.8%
5.8%
6.0%
28.7%
Gender diverse
9.1%
7.0%
9.1%
25.2%
There was not enough data to detect statistically significant differences between gender diverse shelter users and either men or women.
Indigenous status and chronic homelessness
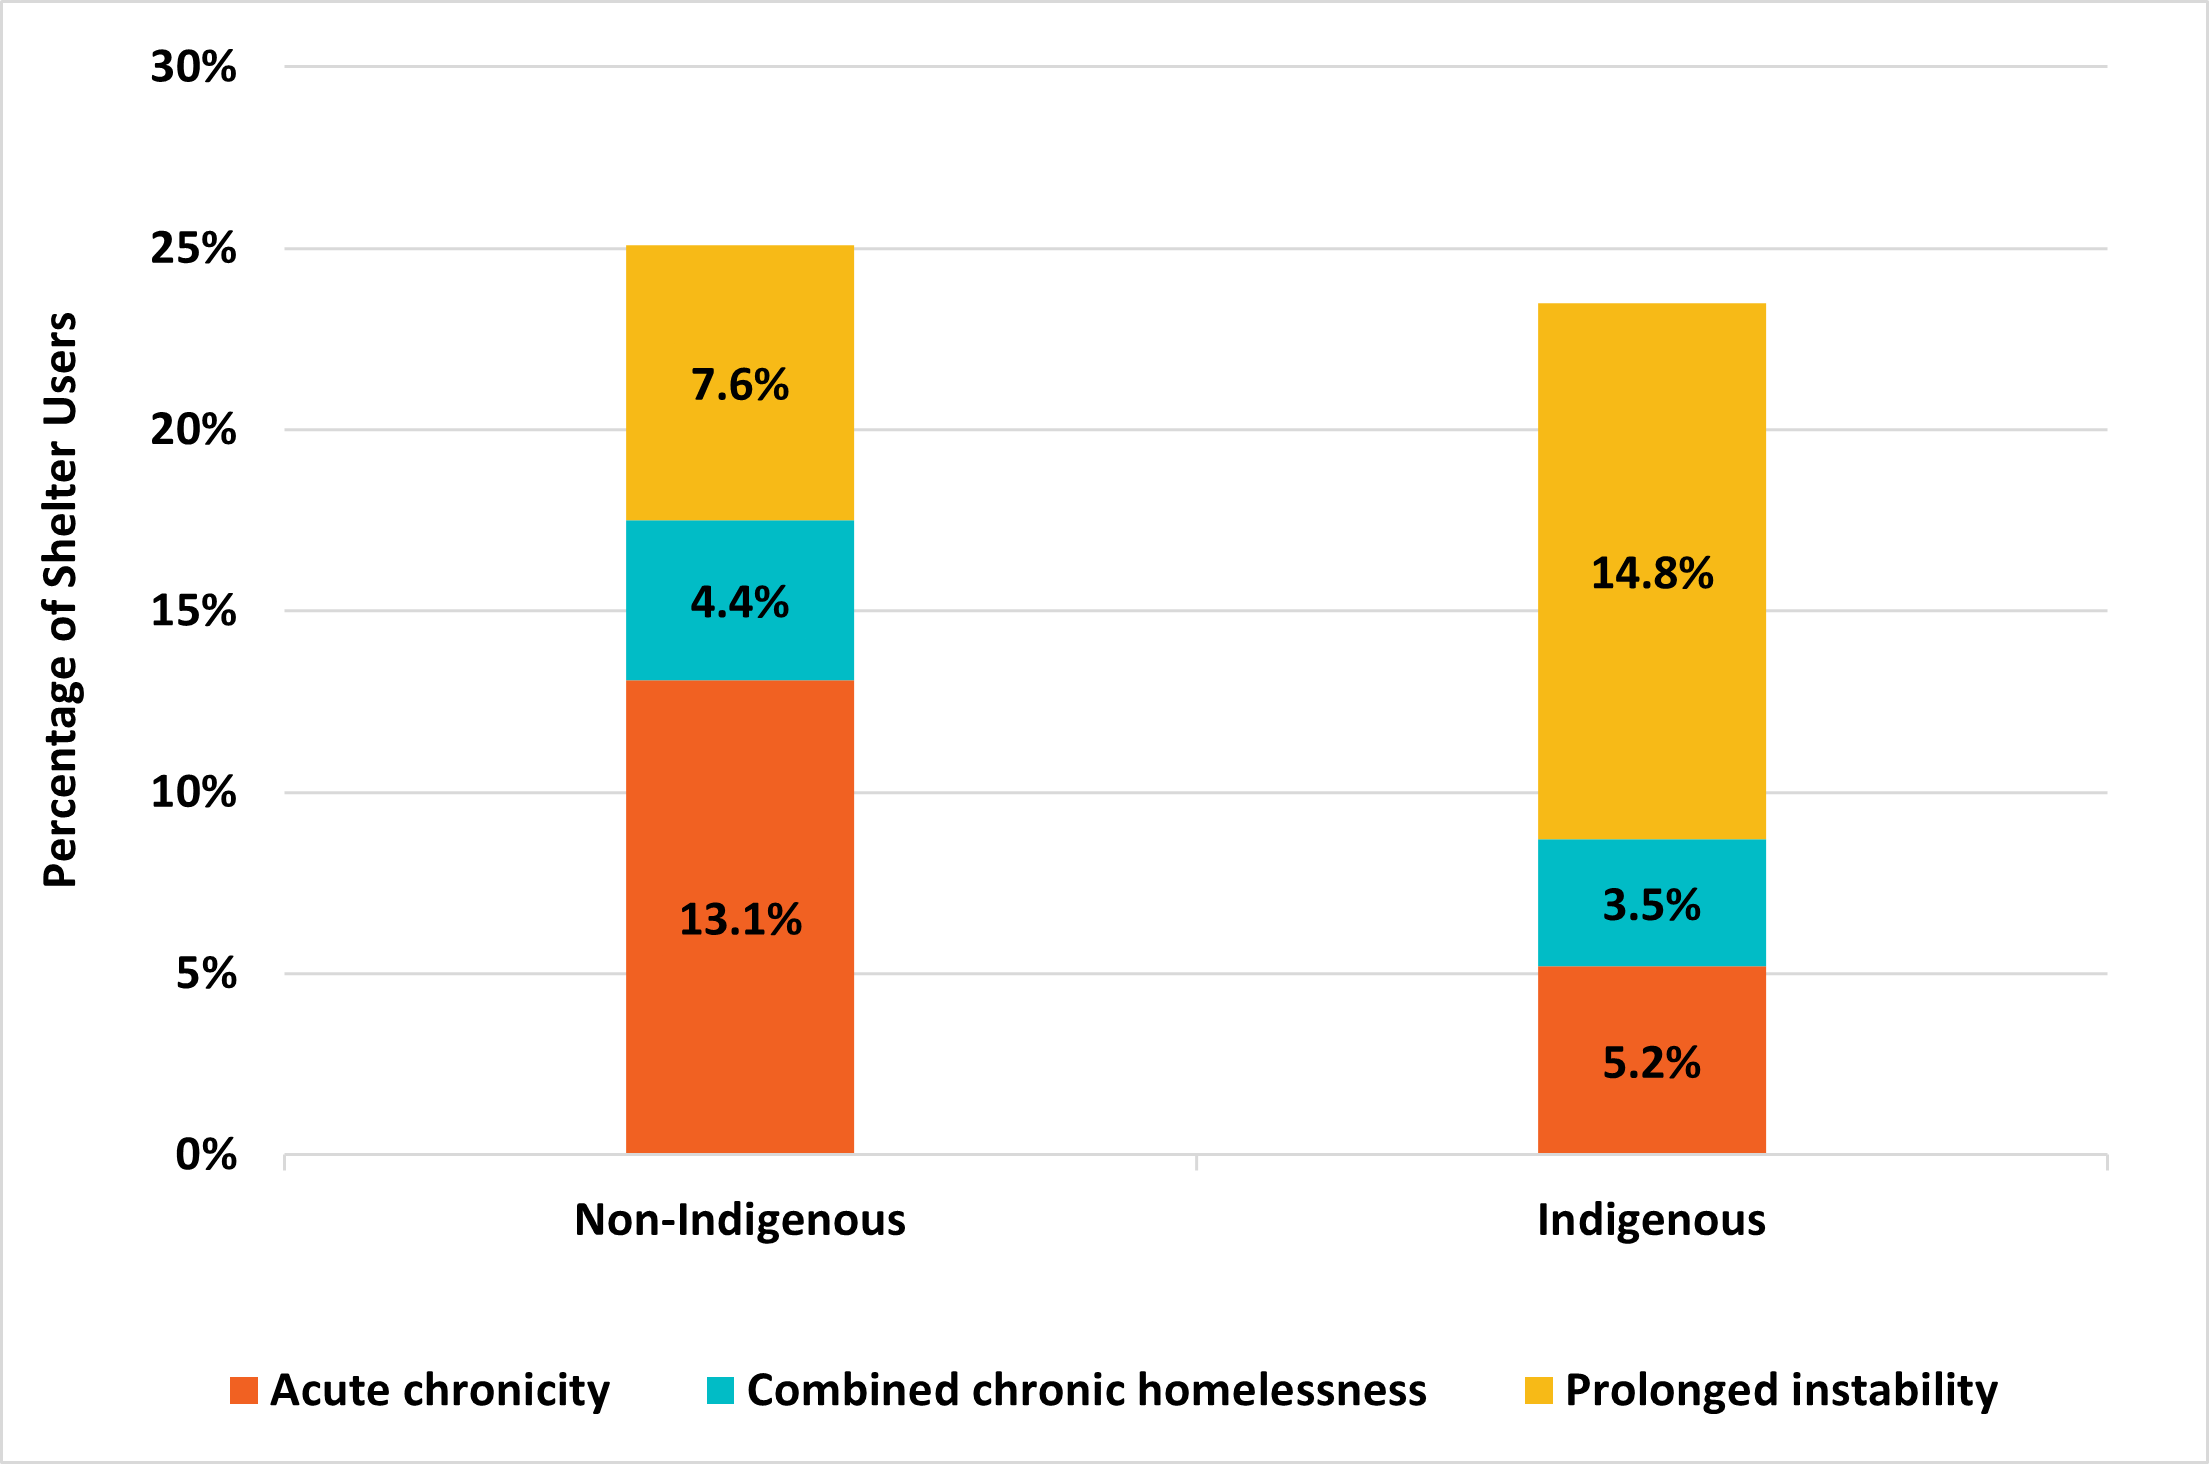
In 2021, the rate of chronic homelessness among shelter users who reported they were Indigenous (23.5%) was similar to the rate of non-Indigenous shelter users (25.1%).Footnote 3
Statistically significant differences were seen in patterns of acute chronicity and prolonged instability (Figure 6).
- Indigenous shelter users had a higher rate of prolonged instability.
- Non-Indigenous shelter users had a higher rate of acute chronicity.
Figure 6: Acute chronicity and prolonged instability by Indigenous status in 2021
-
Figure 6 - Text version
Acute chronicity and prolonged instability by Indigenous status in 2021 Indigenous Status
Acute chronicity
Combined chronic homelessness
Prolonged instability
Total chronic homelessnessFootnote 2
Non-Indigenous
13.1%
4.4%
7.6%
25.1%
Indigenous
5.2%
3.5%
14.8%
23.5%
Indigenous shelter users had similar chronic homelessness rates compared to those who did not identify as Indigenous. It is important to consider, however, that Indigenous respondents to the 2020-2022 Point-in-Time count of homelessness survey were more likely to be in unsheltered locations, and to indicate that they had not used a shelter in the past year. As a result, their experiences of homelessness may be more likely to be missed by shelter system data, leading to an underestimation of chronic homelessness among Indigenous shelter users.
Veteran status and chronic homelessness
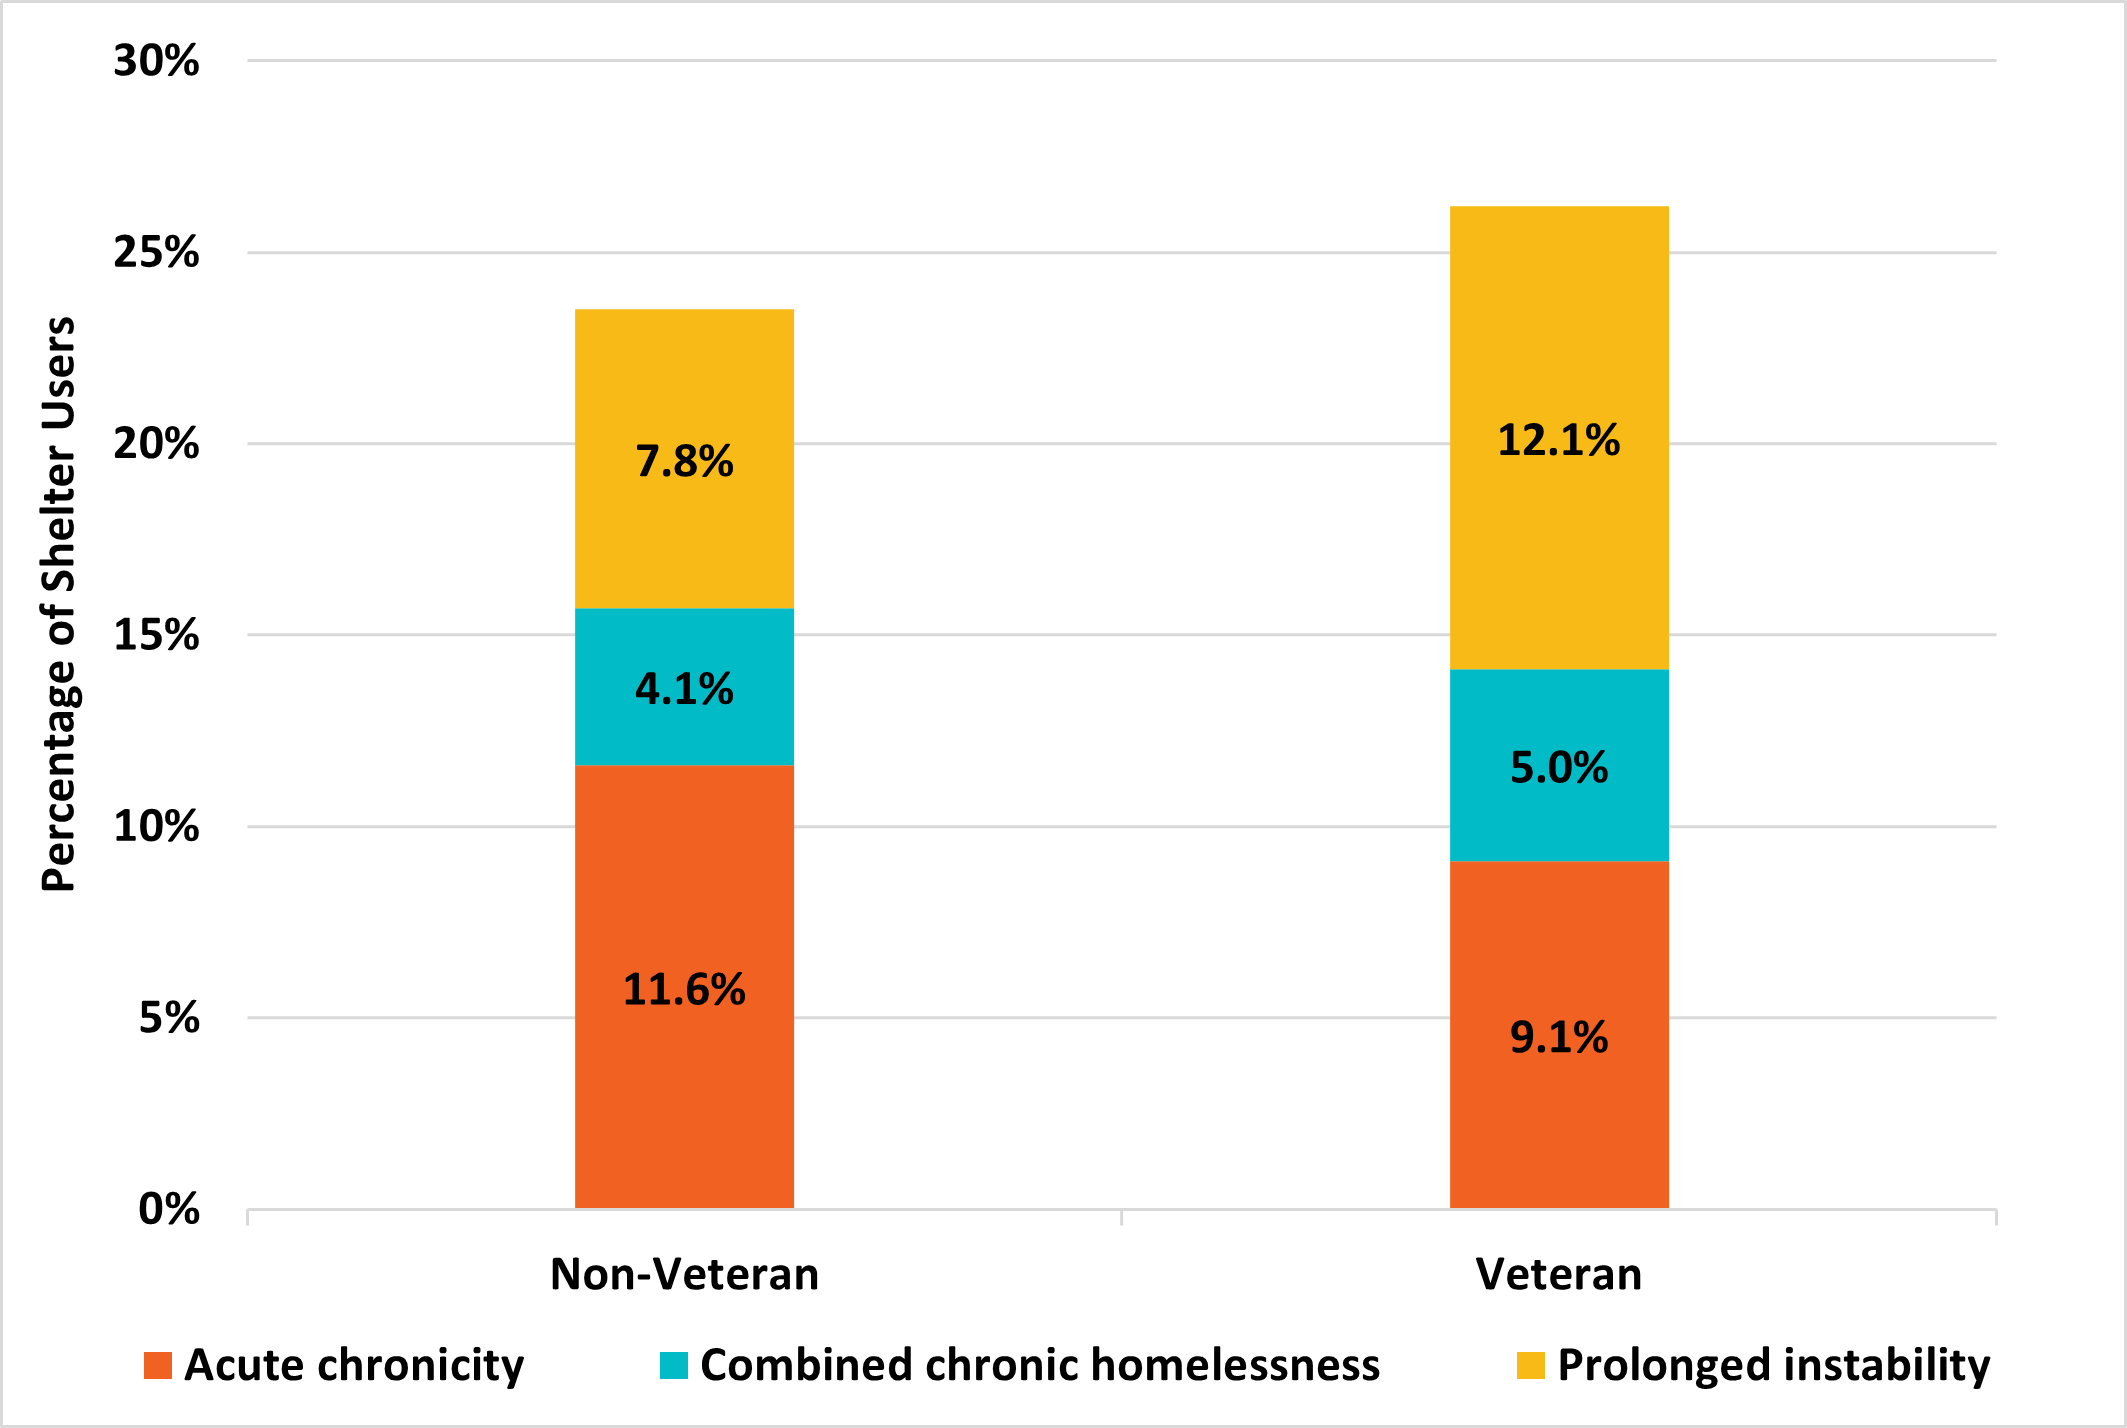
In 2021, the rate of chronic homelessness among shelter users who reported they were veterans (26.2%) was slightly higher than the rate among non-veterans (23.4%).Footnote 4
Statistically significant differences can be seen in patterns of acute chronicity and prolonged instability (Figure 7).
- Veterans had a higher rate of prolonged instability than non-veterans.
- Non-veterans had a higher rate of acute chronicity than veterans.
Figure 7: Acute chronicity and prolonged instability by veteran status in 2021
-
Figure 7 - Text version
Acute chronicity and prolonged instability by veteran status in 2021 Veteran status
Acute chronicity
Combined chronic homelessness
Prolonged instability
Total chronic homelessnessFootnote 2
Non-Veteran
11.6%
4.1%
7.8%
23.4%
Veteran
9.1%
5.0%
12.1%
26.2%
Shelter users who reported that they were a veteran were more likely to experience prolonged instability, compared to non-veteran, who were more likely to experience acute chronicity.
Citizenship status and chronic homelessness
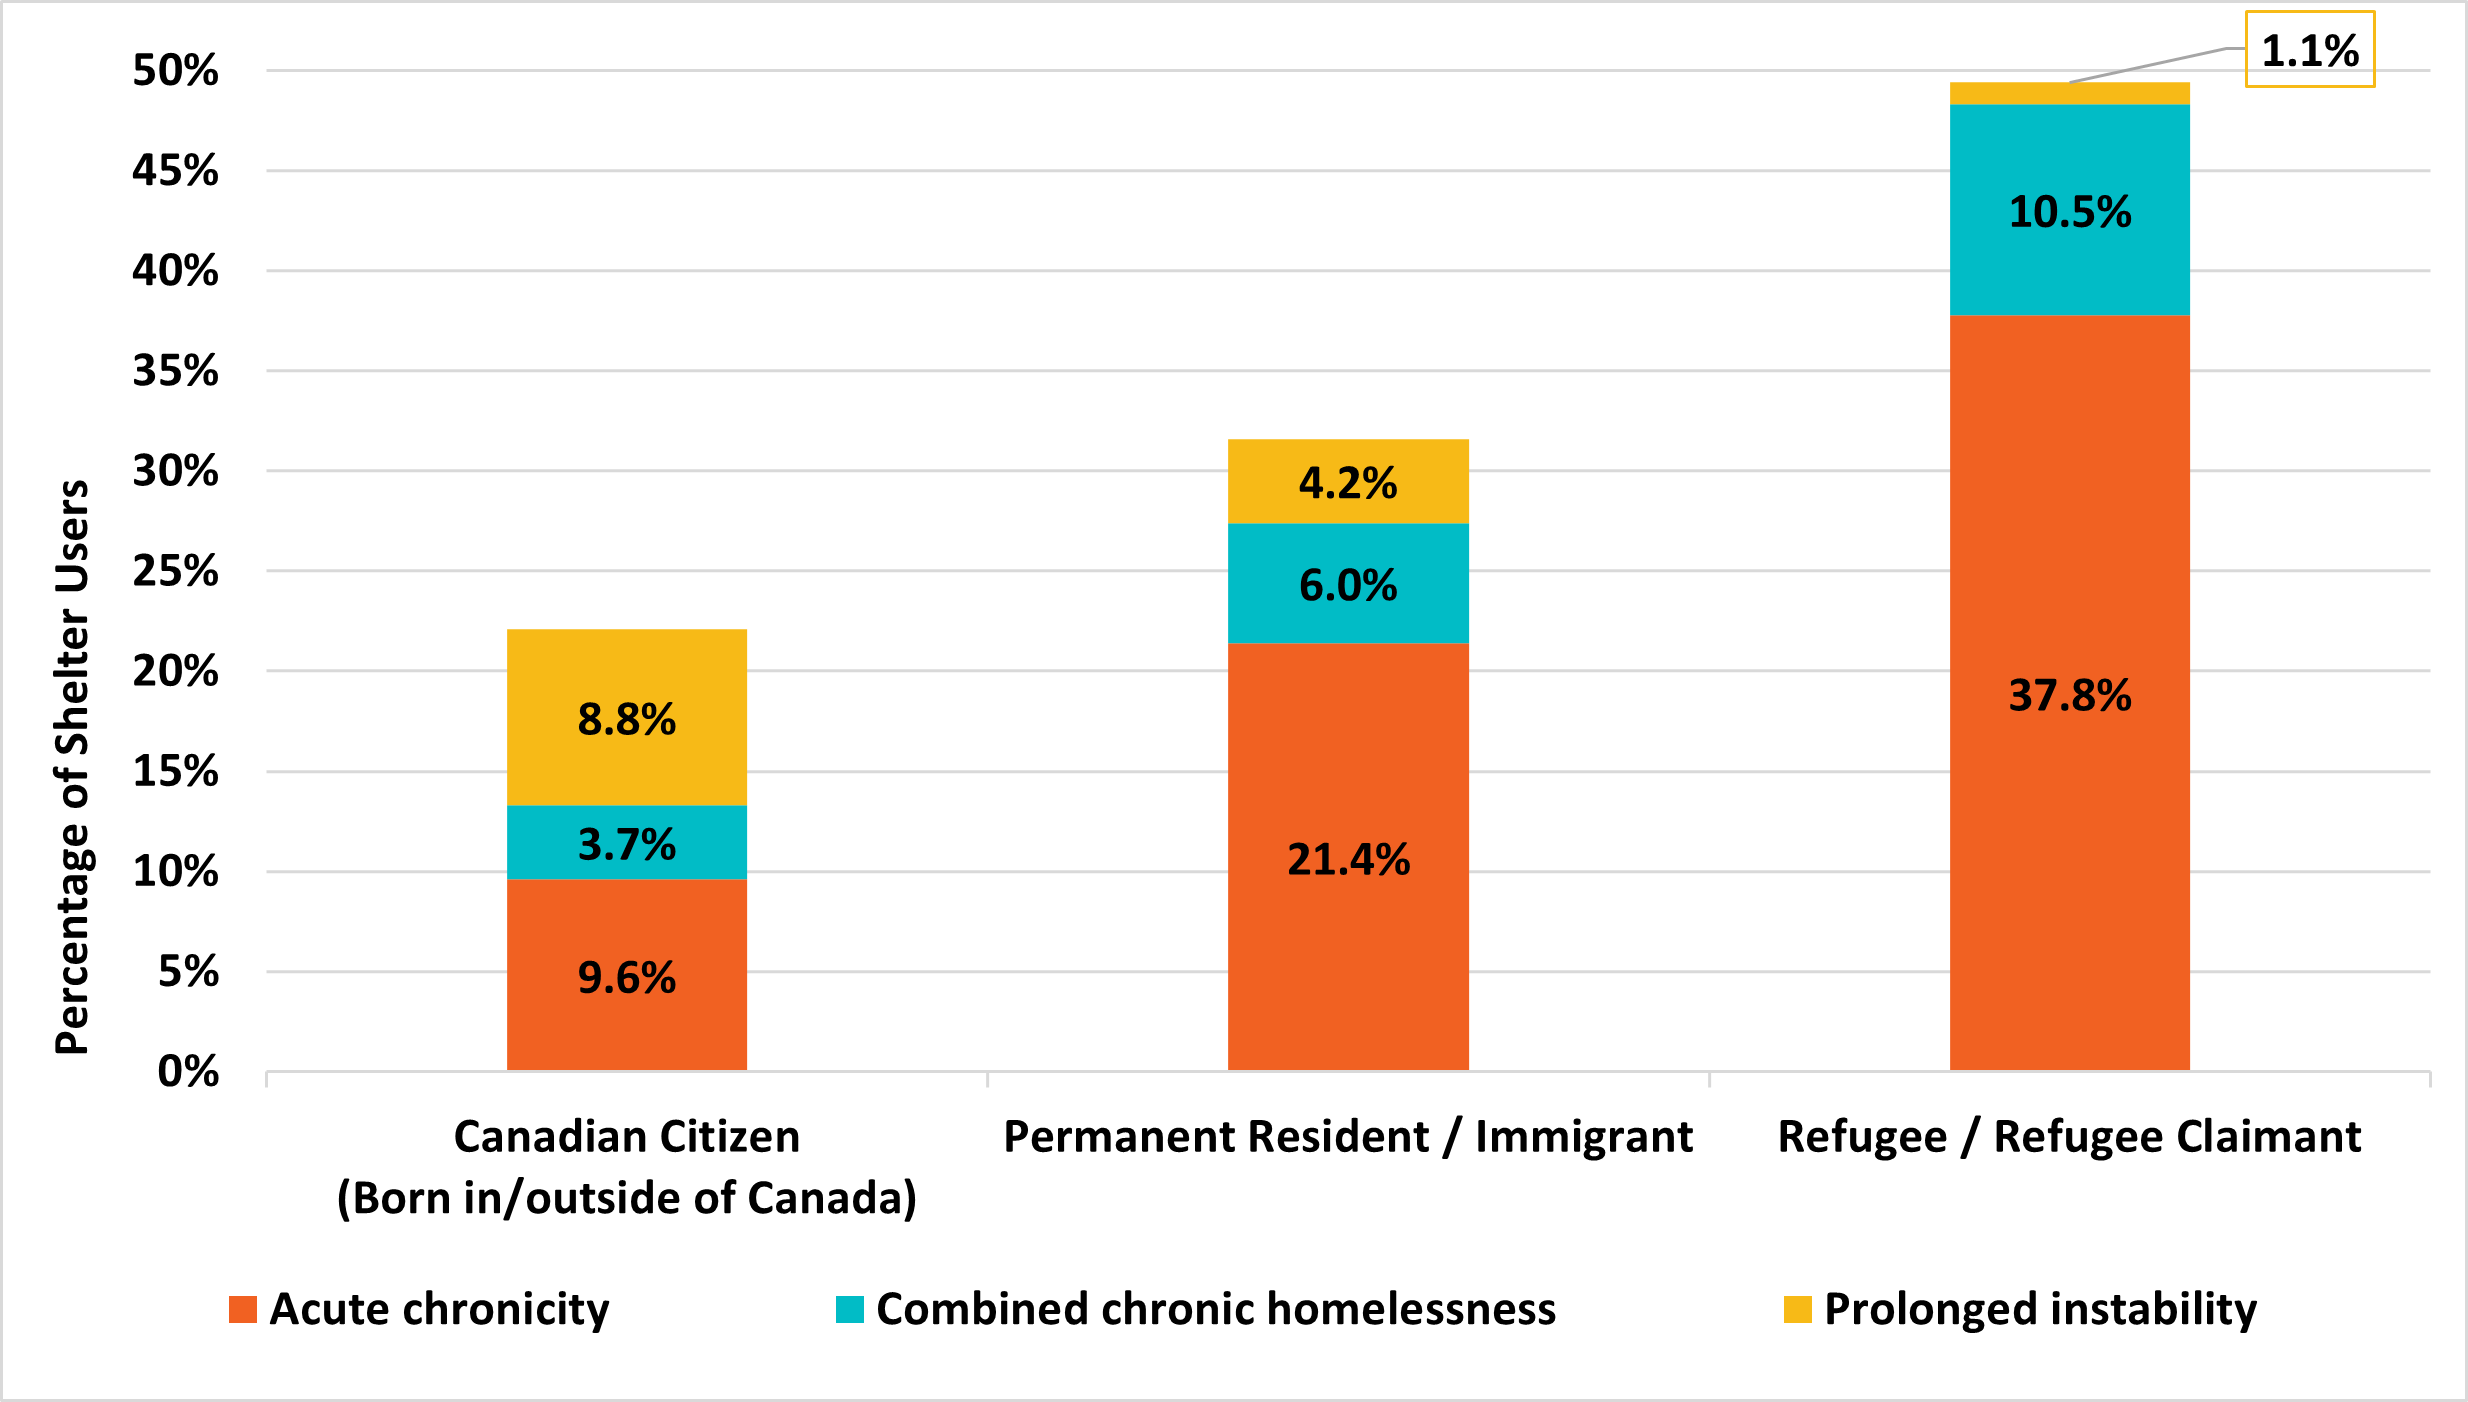
In 2021, differences in the rates of chronic homelessness were observed among different citizenship groups: 22.1% of Canadian citizens, 31.6% of Permanent Residents / Immigrants, and 49.3% of Refugees / Refugee Claimants experienced chronic homelessness.Footnote 5
Statistically significant differences can be seen in patterns of acute chronicity and prolonged instability (Figure 8).
- Canadian citizens had a higher rate of prolonged instability.
- Non-citizens were more likely to experience acute chronicity and combined chronic homelessness.
Figure 8: Acute chronicity and prolonged instability by citizenship status in 2021
-
Figure 8 - Text version
Acute chronicity and prolonged instability by citizenship status in 2021 Citizenship status
Acute chronicity
Combined chronic homelessness
Prolonged instability
Total chronic homelessnessFootnote 2
Canadian Citizen
(Born in/outside of Canada)9.6%
3.7%
8.8%
22.1%
Permanent Resident / Immigrant
21.4%
6.0%
4.2%
31.6%
Refugee / Refugee Claimant
37.8%
10.5%
1.1%
49.3%
Shelter users who reported that they were Refugee / Refugee Claimants had the highest rate of chronic homelessness, followed by Permanent Residents or Immigrants, and then Canadian Citizens.
Key findings
- The estimated number of emergency shelter users experiencing chronic homelessness remained relatively stable between 2017 (28,900) and 2021 (28,631), however due to the drop in overall shelter capacity, they represented a greater proportion of all shelter users in 2021 (30.6%) than in 2017 (22.4%).
- Acute chronicity among shelter users increased from 9.0% in 2017 to 16.0% in 2020, remaining relatively stable in 2021 at 15.2%.
- Prolonged instability remained relatively unchanged, fluctuating between 9.9% in 2017 and 8.2% in 2021.
- Combined chronic homelessness was stable between 2017 and 2019 (3.5% to 3.8%), increasing to 7.2% in 2021.
- Acute chronicity was generally higher among women, accompanied children (0-16), non-Canadian citizens, and non-Indigenous shelter users.
- Prolonged instability was generally higher among men, older adults (50-64), Canadian citizens, veterans and Indigenous shelter users.
A summary table (Table 1) with the estimated rates of chronic homelessness for different groups and a list of the communities included in the analysis are provided in the Annex.
We would like to thank the communities who provided the quality data that made it possible to do complete this analysis.
For more information
Find out more about homelessness research.
If you have any questions about this report, contact us.
Annex: Comparison of acute chronicity and prolonged instability within each population
|
Acute chronicity |
Combined chronic homelessness |
Prolonged instability |
OverallFootnote 2 |
|---|---|---|---|---|
Children (0-16 Accompanied) |
28.2% |
4.4% |
0.9% |
33.6% |
Youth (13-24 Unaccompanied) |
13.4% |
4.1% |
5.9% |
23.4% |
Adult (25-49) |
12.5% |
6.5% |
9.9% |
28.9% |
Older Adult (50-64) |
16.9% |
12.4% |
9.6% |
38.9% |
Senior (65+) |
20.9% |
12.8% |
6.9% |
40.6% |
Men |
14.4% |
8.0% |
9.4% |
31.9% |
Women |
16.8% |
5.8% |
6.0% |
28.7% |
Gender diverse |
9.1% |
7.0% |
9.1% |
25.2% |
Non-Indigenous |
13.1% |
4.4% |
7.6% |
25.1% |
Indigenous |
5.2% |
3.5% |
14.8% |
23.5% |
Non-Veteran |
11.6% |
4.1% |
7.8% |
23.4% |
Veteran |
9.1% |
5.0% |
12.1% |
26.2% |
Canadian Citizen |
9.6% |
3.7% |
8.8% |
22.1% |
Permanent Resident / Immigrant |
21.4% |
6.0% |
4.2% |
31.6% |
Refugee / Refugee Claimant |
37.8% |
10.5% |
1.1% |
49.3% |
Report a problem on this page
- Date modified: